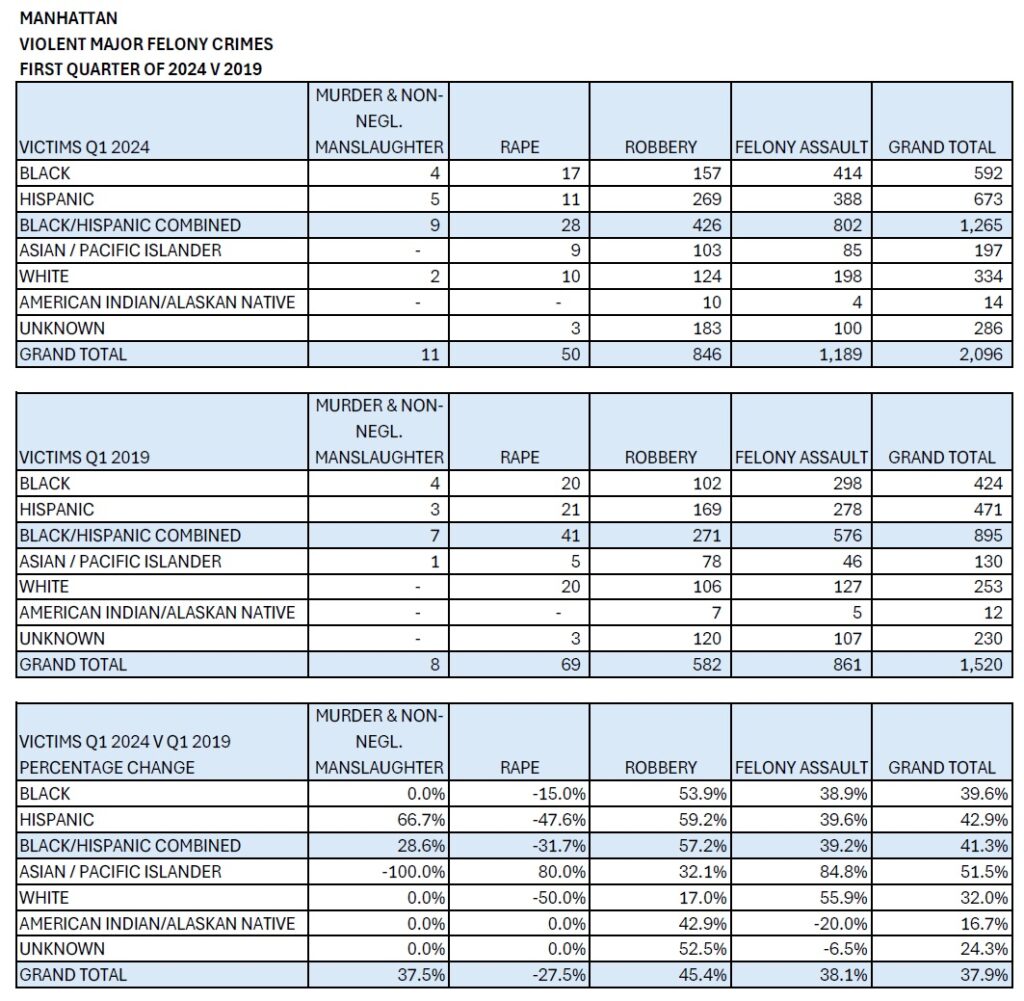
In the heart of New York City, Manhattan has long been a vibrant and dynamic urban landscape. However, beneath its glittering skyline lies a complex tapestry of social, economic, and political forces. Between the first quarter of 2019, prior to the COVID pandemic and the implementation of New York State’s criminal justice reform laws (bail and discovery reform), and the first quarter of 2024, Manhattan experienced significant changes in violent major felony crimes, unfortunately taking a turn for the worse.
During this transformative period, the numbers speak volumes. Overall violent major felony crimes surged by 37.9%, casting a shadow over the city that never sleeps. Murders, once relatively contained, climbed by 37.5%, leaving communities grappling with loss and fear. Robberies, with a staggering 45.4% increase, underscored the vulnerability of both individuals and businesses. And felony assaults, rising by 38.1%, shattered any illusions of safety. Amidst this unsettling landscape, there was one glimmer of hope: a 27.5% decrease in reported rapes from 2019 to 2024. Yet, even within this statistical relief, the pain endured by survivors remains palpable.
The spike in crime has affected all demographics, but it is predominantly people of color—Blacks and Hispanics—who have suffered the most, with a 41.3% increase in victims of violent major felonies, accounting for 69.9% of such victims in the first quarter of 2024, up from 69.4% in the same period of 2019. This data underscores the disproportionate impact of crime on different communities.
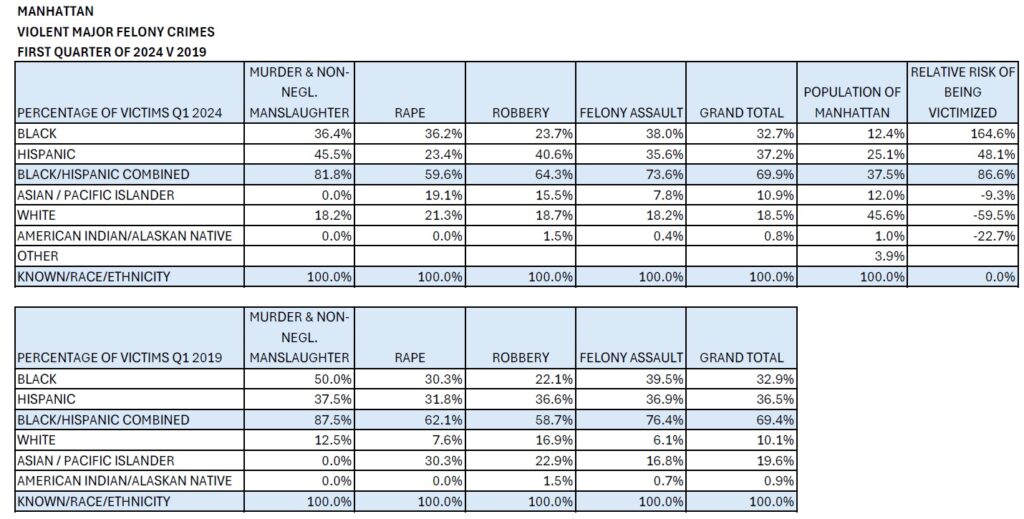
A closer look at the probability of victimization compared to population share reveals distinct patterns. Blacks are 164.6% more likely to fall prey to violent major felonies, while Hispanics have a 48.1% higher chance of victimization. Combined, Blacks and Hispanics are 86.6% more susceptible to these crimes. Conversely, Asian and Pacific Islanders, Whites, and Native Americans are less likely to be victimized in comparison to their population percentages.
Victimization Probability Relative to Population Share
Crime statistics provide valuable insights into the safety and security of a community. In Manhattan, the first quarter of 2024 saw variations in crime rates across different racial and ethnic groups. Let’s delve into the data and explore the relative risk of victimization for each group.
- Black Individuals: Despite constituting only 12.4% of Manhattan’s population, Black individuals accounted for 32.7% of crime victims in Q1 2024. Their relative risk of victimization was 164.6%.
- Hispanic Individuals: Representing 25.1% of the population, Hispanic individuals were victims in 37.2% of cases, resulting in a relative risk of 48.1%.
- Black/Hispanic Combined: Together, Black and Hispanic individuals made up 37.5% of the population but accounted for 69.9% of crime victims. Their relative risk stood at 86.6%.
- White Individuals: Despite constituting 45.6% of Manhattan’s population, White individuals were victims in only 18.5% of cases, indicating a significant negative relative risk (-59.5%).
- Asian/Pacific Islanders: Underrepresented among crime victims (10.9%) compared to their population share (12%), resulting in a negative relative risk (-9.3%).
In summary, the data highlights stark disparities in victimization rates based on race and ethnicity. Policymakers and law enforcement agencies must address these disparities to ensure safety and equity for all residents of Manhattan.
Conclusion
The stark disparities in violent major felony crimes within Manhattan demand our urgent attention. As the city grapples with rising crime rates, we must recognize that these statistics represent more than mere numbers—they reflect the lived experiences of our fellow New Yorkers. The pain endured by survivors, particularly those from marginalized communities, remains palpable. We cannot turn a blind eye to the disproportionate impact on people of color, who bear the brunt of victimization. Only through concerted efforts can we hope to restore safety, trust, and resilience to our vibrant urban landscape.
Statistical Note: The data presented is sourced from the NYC Open Data databases, courtesy of the NYPD. Minor discrepancies (1.1% overall) exist between the Open Data databases and the historical CompStat 2.0 figures, but these do not significantly alter the essence of the data.
Written by:
Sam Antar
© Copyright by Sam Antar. All rights reserved.

