Introduction
This essay examines crime victimization rates among different racial and ethnic groups in the United States from 2009 to 2023, spanning the Obama, Trump, and Biden administrations. The data is sourced from the Bureau of Justice Statistics (BJS) National Crime Victimization Survey (NCVS) and presents rates of violent victimizations per 1,000 people aged 12 or older. The analysis includes comparisons with and without the pandemic years (2020 and 2021) to account for anomalies caused by COVID-19.
Key Findings
- Obama Administration (2009-2016): Minorities, especially Black Americans, American Indian/Alaska Native, and multiracial individuals, experienced high and volatile victimization rates.
- Trump Administration (2017-2020): There was a notable decrease in victimization rates for most minority groups, particularly Black Americans.
- Biden Administration (2021-2023): Victimization rates increased for all groups, with Black Americans seeing a significant rise compared to the Trump years.
Throughout all administrations, American Indian/Alaska Native and multiracial individuals consistently faced the highest victimization rates, while Asian/Native Hawaiian or Other Pacific Islander Americans had the lowest rates, though they have recently increased.
Data Source: BJS vs. FBI
This analysis uses data from the Bureau of Justice Statistics (BJS) rather than the Federal Bureau of Investigation (FBI). There are several reasons for this choice:
- Comprehensive Data: The BJS data, sourced from the NCVS, includes both reported and unreported crimes. In contrast, FBI data from the Uniform Crime Reporting (UCR) program only includes crimes reported to law enforcement.
- Consistency: The NCVS uses consistent methodology across years and regions, making it more reliable for trend analysis. FBI data can be affected by changes in local reporting practices or definitions of crimes.
- Detailed Demographics: The NCVS provides more detailed demographic information about victims, including race and ethnicity, which is crucial for this analysis. FBI data often lacks this level of detail.
- Focus on Victimization: The NCVS is specifically designed to measure victimization, aligning perfectly with the goals of this analysis. FBI data focuses more on reported incidents and arrests.
- Timeliness: BJS data is often released more quickly than comprehensive FBI data, allowing for more current analysis.
While FBI data is valuable for understanding reported crime and law enforcement activities, the BJS data from the NCVS is more appropriate for analyzing victimization trends across different demographic groups.
Definition of Violent Crime
The BJS defines violent crime in the context of the NCVS as rape or sexual assault, robbery, aggravated assault, and simple assault. Specifically:
- Rape: Forced sexual intercourse, including both psychological coercion and physical force. This category includes attempted rapes, male and female victims, and both heterosexual and same-sex rape.
- Sexual Assault: A wide range of victimizations distinct from rape or attempted rape. These crimes include attacks or attempted attacks generally involving unwanted sexual contact between victim and offender.
- Robbery: Completed or attempted theft directly from a person, of property or cash, by force or threat of force, with or without a weapon, and with or without injury.
- Aggravated Assault: Attack or attempted attack with a weapon, regardless of whether an injury occurred, and attack without a weapon when serious injury results.
- Simple Assault: Attack without a weapon resulting in no injury, minor injury, or an undetermined injury requiring less than two days of hospitalization. This also includes attempted assault without a weapon.
This comprehensive definition ensures that the NCVS captures a wide range of violent victimizations, providing a more complete picture of the prevalence of violence in society than might be gleaned from police reports alone.
Note on Homicides and Simple Assaults
Understanding the differences between the BJS data from the NCVS and other crime data sources, such as the FBI’s UCR program, is essential:
- Exclusion of Homicides: Homicides are excluded from the BJS data because the NCVS is based on interviews with victims, and the deceased cannot be interviewed. However, this does not significantly change the overall violent crime rates or the trends observed in this analysis, as homicides are less common than other violent crimes and typically constitute a small percentage of the total.
- Inclusion of Simple Assaults: Unlike the FBI’s UCR program, the BJS data includes simple assaults in its violent crime statistics. Simple assaults are unarmed attacks that may result in no injury, minor injury, or an unspecified injury requiring less than two days of hospitalization, including attempted unarmed assaults. Simple assaults are more frequent than aggravated assaults, robberies, or sexual assaults. Including them offers a more complete picture of the violent crime people experience. While simple assaults are considered less serious than other violent crimes, they can still cause significant psychological and emotional harm to victims.
The inclusion of simple assaults in the BJS data means that it captures a wider range of violent incidents than the FBI’s UCR program. This broader definition provides a more comprehensive view of violent victimization experiences, even without the inclusion of homicides. Therefore, while it’s important to be aware of this limitation in the data, the exclusion of homicides does not significantly impact the validity of the analysis or the trends observed across different racial and ethnic groups and administrations.
Overview of the Data
 The data covers five main racial/ethnic categories:
- White
- Black
- Hispanic
- Asian/Native Hawaiian or Other Pacific Islander
- American Indian or Alaska Native and persons of two or more races
The analysis focuses on trends within each administration and comparisons between them, both including and excluding the pandemic years.
Obama Administration (2009-2016)
During the Obama administration, we observe the following trends:
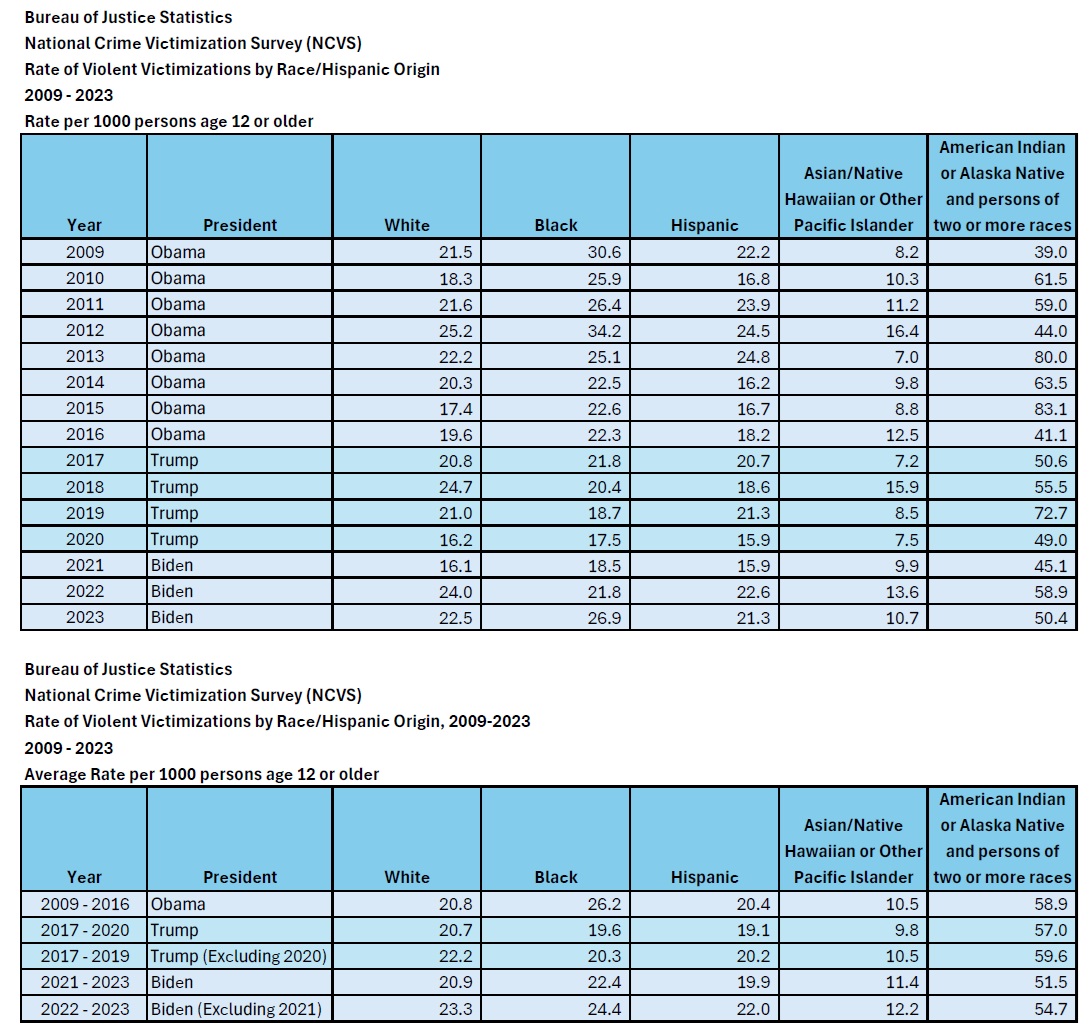
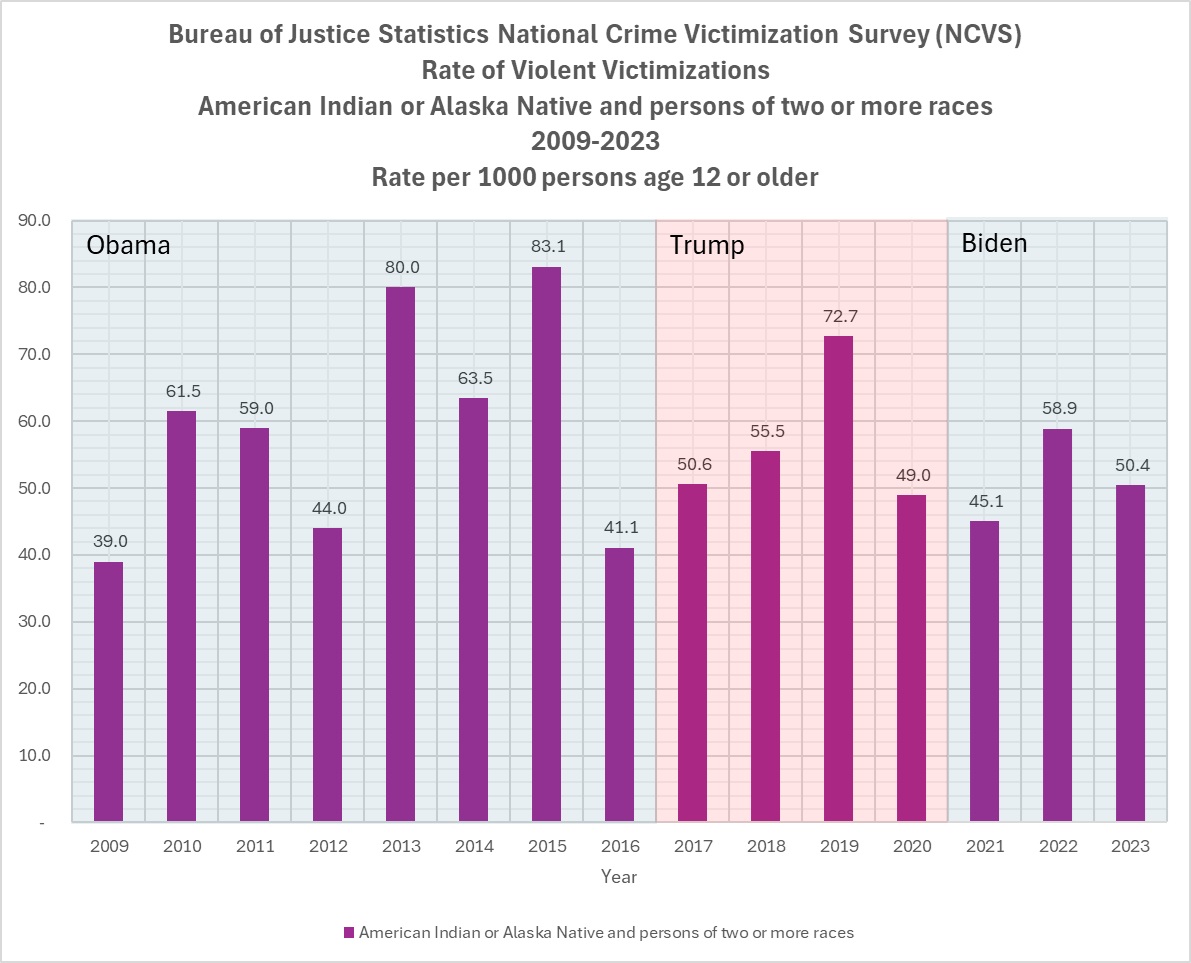
- American Indian or Alaska Native and persons of two or more races experienced the highest rates of violent victimization, with an average of 58.9 per 1,000 persons.
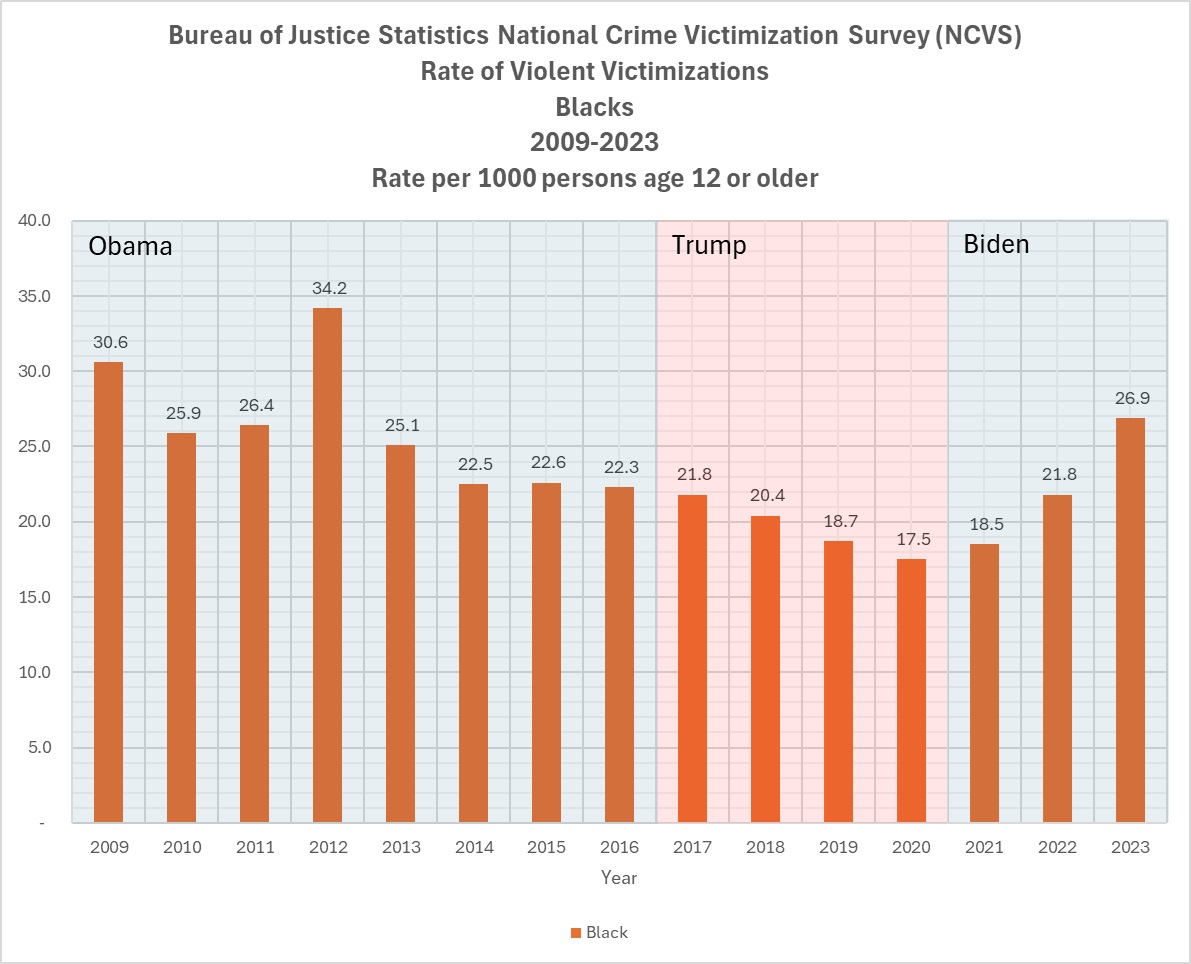
- Black Americans had the second-highest average rate at 26.2 per 1,000.
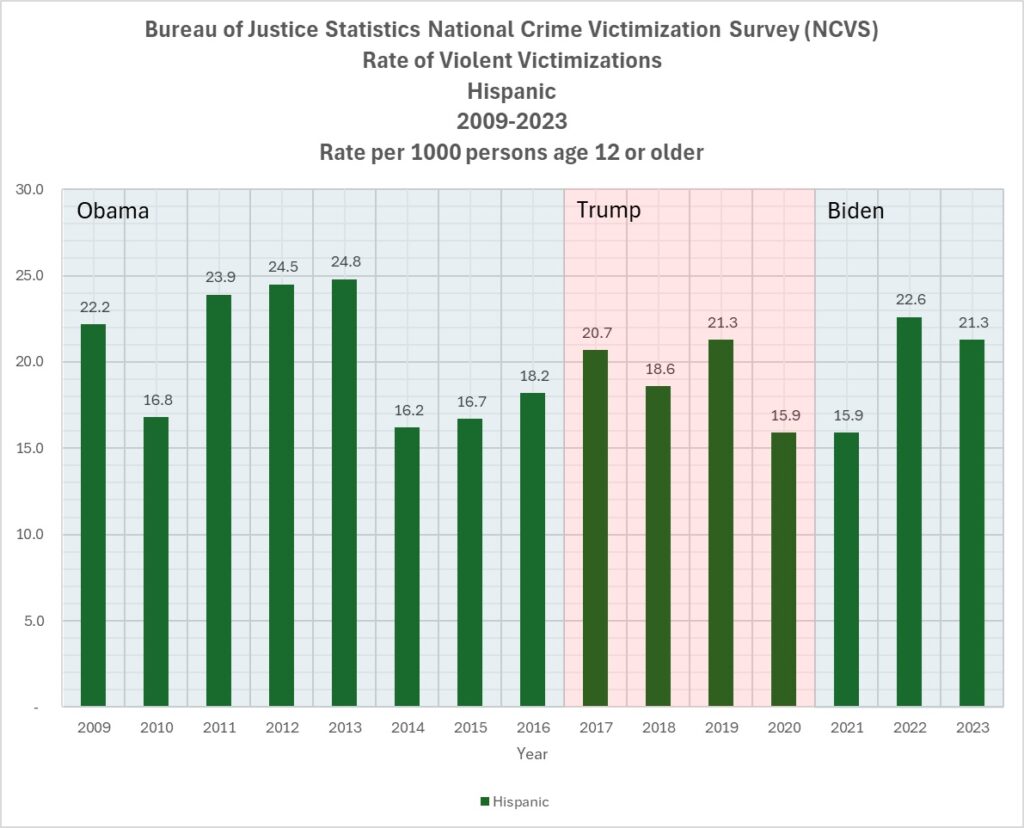
- Hispanic Americans experienced an average rate of 20.4 per 1,000.
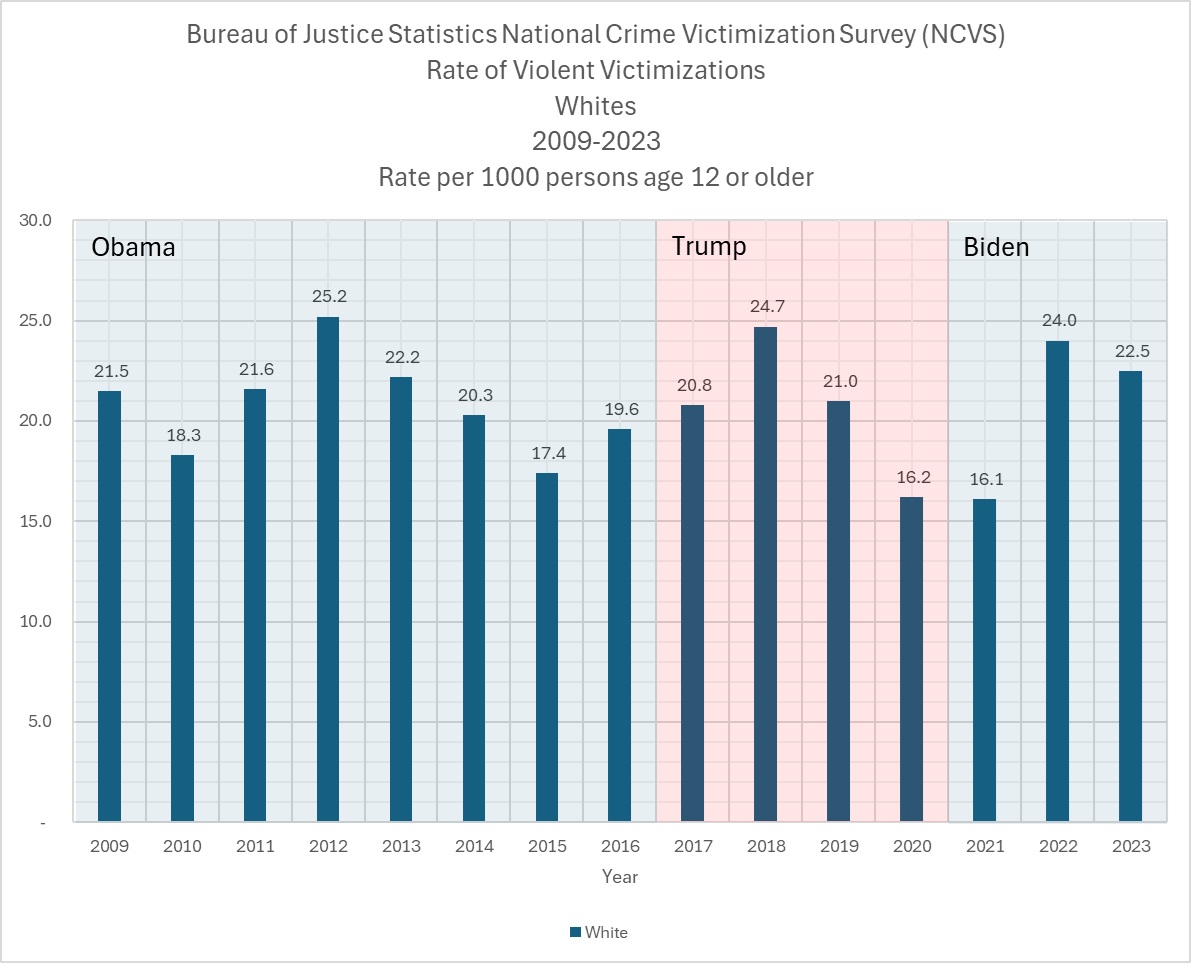
- White Americans had an average rate of 20.8 per 1,000, slightly higher than Hispanic Americans.
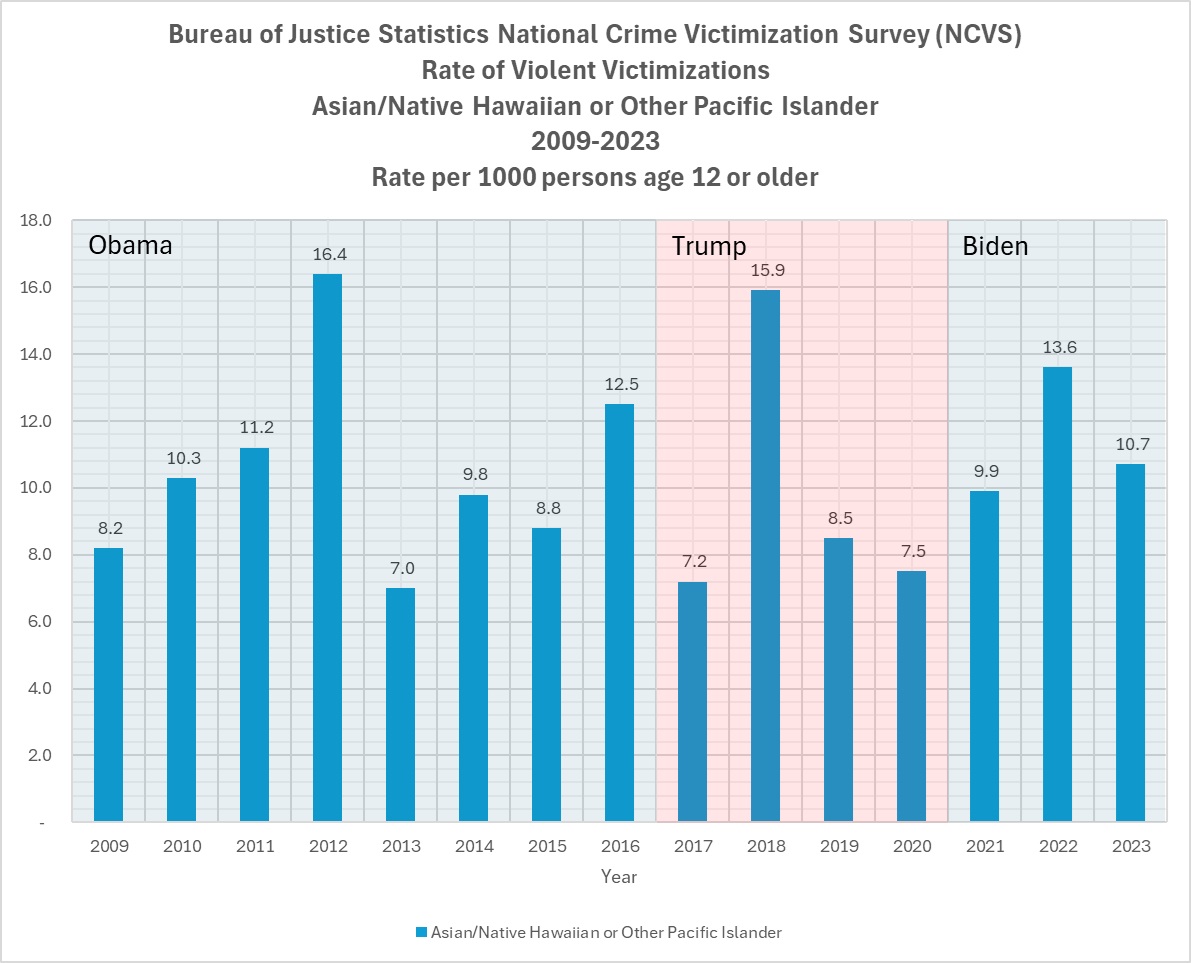
- Asian/Native Hawaiian or Other Pacific Islander Americans had the lowest average rate at 10.5 per 1,000.
The overall trend during this period was somewhat volatile, with peaks and troughs for all groups. Notably, there was a significant spike in victimization rates for most groups in 2012, followed by a general decline.
Trump Administration (2017-2020)
The Trump administration saw some shifts in the patterns of victimization:
- Including pandemic year (2020):
- American Indian or Alaska Native and persons of two or more races: 57.0 per 1,000
- White Americans: 20.7 per 1,000
- Black Americans: 19.6 per 1,000
- Hispanic Americans: 19.1 per 1,000
- Asian/Native Hawaiian or Other Pacific Islander Americans: 9.8 per 1,000
- Excluding pandemic year (2020):
- American Indian or Alaska Native and persons of two or more races: 59.6 per 1,000
- White Americans: 22.2 per 1,000
- Black Americans: 20.3 per 1,000
- Hispanic Americans: 20.2 per 1,000
- Asian/Native Hawaiian or Other Pacific Islander Americans: 10.5 per 1,000
Biden Administration (2021-2023)
The data for the Biden administration covers three years, including two post-pandemic years:
- Including pandemic year (2021):
- American Indian or Alaska Native and persons of two or more races: 51.5 per 1,000 Black Americans: 22.4 per 1,000
- White Americans: 20.9 per 1,000
- Hispanic Americans: 19.9 per 1,000
- Asian/Native Hawaiian or Other Pacific Islander Americans: 11.4 per 1,000
- Excluding pandemic year (2021):
- American Indian or Alaska Native and persons of two or more races: 54.7 per 1,000
- Black Americans: 24.4 per 1,000
- White Americans: 23.3 per 1,000
- Hispanic Americans: 22.0 per 1,000
- Asian/Native Hawaiian or Other Pacific Islander Americans: 12.2 per 1,000
Comparative Analysis
Pandemic Impact
The years 2020 and 2021 saw marked decreases in victimization rates across all groups, likely due to COVID-19 lockdowns and reduced social interaction. Excluding these years provides a starker contrast between administrations and reveals higher overall victimization rates.
Group-Specific Trends
- American Indian/Alaska Native and Multiracial Individuals:
-
- Obama Administration (2009-2016): Highest average rate at 58.9 per 1,000, with significant volatility (ranging from 39.0 to 83.1).
- Trump Administration (2017-2020): Slight decrease to 57.0 per 1,000 (59.6 excluding 2020), representing a 3.2% decrease from the Obama era.
- Biden Administration (2021-2023): Further decrease to 51.5 per 1,000 (54.7 excluding 2021), a 9.6% decrease from the Trump era.
- Overall Trend: Despite remaining significantly higher than other groups, there’s a gradual downward trend across administrations.
-
- Black Americans:
-
- Obama Administration (2009-2016): Second-highest average rate at 26.2 per 1,000, with considerable volatility.
- Trump Administration (2017-2020): Notable decrease to 19.6 per 1,000 (20.3 excluding 2020), a 25% decrease from the Obama era.
- Biden Administration (2021-2023): Increase to 22.4 per 1,000 (24.4 excluding 2021), a 14% increase from the Trump era.
- Overall Trend: Significant decrease during Trump years, followed by an increase under Biden, but still lower than Obama-era rates.
-
- White Americans:
- Obama Administration (2009-2016): Average rate of 20.8 per 1,000.
- Trump Administration (2017-2020): Slight decrease to 20.7 per 1,000 (22.2 excluding 2020), remaining relatively stable.
- Biden Administration (2021-2023): Slight increase to 20.9 per 1,000 (23.3 excluding 2021), a 1% increase from the Trump era.
- Overall Trend: Relatively stable across administrations, with a slight increase in non-pandemic years under Biden.
- Hispanic Americans:
-
- Obama Administration (2009-2016): Average rate of 20.4 per 1,000.
- Trump Administration (2017-2020): Decrease to 19.1 per 1,000 (20.2 excluding 2020), a 6.4% decrease from the Obama era.
- Biden Administration (2021-2023): Slight increase to 19.9 per 1,000 (22.0 excluding 2021), a 4.2% increase from the Trump era.
- Overall Trend: Slight decrease during Trump years, followed by an increase under Biden, returning close to Obama-era rates.
-
- Asian/Native Hawaiian or Other Pacific Islander Americans:
- Obama Administration (2009-2016): Lowest average rate at 10.5 per 1,000.
- Trump Administration (2017-2020): Slight decrease to 9.8 per 1,000 (10.5 excluding 2020), remaining relatively stable.
- Biden Administration (2021-2023): Increase to 11.4 per 1,000 (12.2 excluding 2021), a 16.3% increase from the Trump era.
- Overall Trend: Consistently lowest rates among all groups, but showing an upward trend in recent years, especially when excluding pandemic years.
Shifting Racial Disparities: The gap between different racial/ethnic groups has fluctuated across administrations. The disparity was most pronounced during the Obama years, narrowed significantly during the Trump administration (especially when excluding 2020), and has widened again under Biden, though not to Obama-era levels.
Post-Pandemic Surge
The exclusion of pandemic years reveals a significant increase in victimization rates during the Biden administration for all groups, suggesting a possible “rebound effect” as social interactions normalized.
Conclusion
This analysis, considering both pandemic and non-pandemic years, reveals the complex nature of violent victimization trends across racial and ethnic groups and administrations. The inclusion of pandemic years (2020 and 2021) significantly impacts the overall averages and can mask underlying trends.
Written by,
Sam Antar
© Copyright by Sam Antar. All rights reserved.