NYC Violent Major Felonies
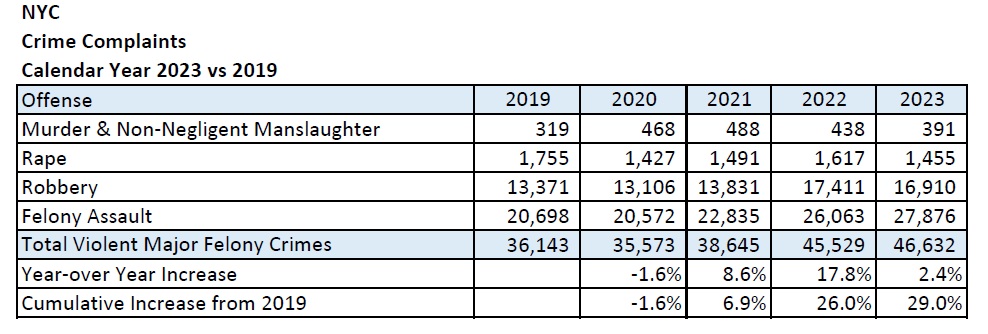
Between 2019, the year preceding the COVID pandemic and the enactment of New York State’s criminal justice reform laws (bail and discovery reform), and 2023, New York City saw a 29% increase in overall violent major felony crimes. Murder rates climbed by 22.6%, robberies by 26.5%, and felony assaults by 34.7%. The sole decline was a 17.1% decrease in reported rapes from 2019 to 2023. All racial and ethnic groups experienced significant rises in crime rates, although the impacts differed among groups.
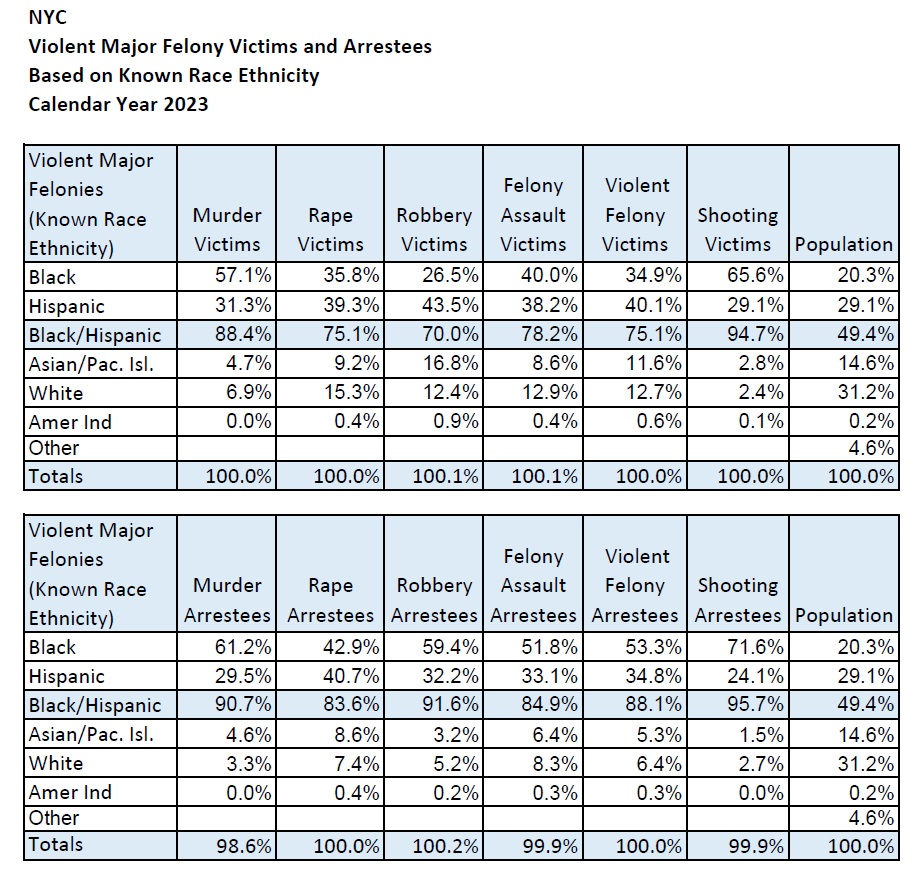
In 2023, New York City’s Black and Hispanic communities, which comprise 49.4% of the city’s population, were disproportionately affected by crime. These groups accounted for a significant majority of crime victims: 88.4% of murder victims, 75.1% of rape victims, 70% of robbery victims, 78.2% of felony assault victims, and 94.7% of shooting victims. Moreover, they represented 75.1% of all victims of violent major felonies. Arrest statistics also indicated a high percentage of Black and Hispanic individuals: 90.7% for murder, 83.6% for rape, 91.6% for robbery, 84.9% for felony assault, and 95.7% for shootings, with 88.1% of arrests for violent major felonies involving individuals from these communities.
Conversations about crime in New York City often reduce the complex issue to the assumption that the racial or ethnic background of those apprehended for serious violent crimes should reflect their proportion in the general population. A more effective and compassionate approach to aiding crime victims would be for law enforcement to concentrate on the actual offenders. Despite the legal debates over Stop, Question, and Frisk strategies, the demographic patterns observed in police stop-and-frisk incidents align with arrests for major violent crimes. This suggests that police actions are a response to the demographics of criminal behavior, not merely a politically motivated outcome.
In 2019, the New York Police Department (NYPD) boasted a workforce of 23,731 police officers and 36,289 uniformed officers. However, by 2023, these numbers had significantly dwindled, with police officers decreasing by 9.0% to 21,599 and uniformed officers dropping by 7.4% to 33,612. At the same time, there was a considerable 29% increase in major violent felony crimes, rising from 36,143 in 2019 to 46,632. This equates to an uptick of 4.9 crimes for each reduction in police officers and 3.9 crimes for each reduction in uniformed officers. Moreover, the number of major violent felony victims within the combined Black and Hispanic communities escalated by 34.1%, from 24,650 in 2019 to 33,054 in 2023. The decrease in police and uniformed officers corresponds to an additional 3.9 and 3.1 victims, respectively, from these communities.
Over four years, the NYPD has witnessed a substantial increase in diversity. The combined percentage of Black and Hispanic police officers and uniformed officers was 46.7% and 44.0% in 2019, respectively. By 2023, this combined percentage rose to 51.8% and 47.9%, respectively, closely reflecting their combined representation of 49.4% in the overall population.
The ensuing detailed analysis will explore the effects of violent major felonies on each racial and ethnic group in NYC, contrasting data from 2019—before the enactment of bail and discovery reform laws and the onset of the COVID pandemic—with that of 2023, the most recent complete year for which data is available.
*Please refer to the statistical note at the end of the post
Violent Major Felony Victims and Arrestees
The data below provides a comprehensive view of the distribution of violent major felony victims and arrestees in NYC for the year 2023, categorized by known race and ethnicity.
Here is a detailed analysis of the key points:
- Black Community: Black individuals are disproportionately represented as murder victims (57.1%) and shooting victims (65.6%) compared to their population share (20.3%). They also constitute a higher percentage of murder arrestees (61.2%) and shooting arrestees (71.6%).
- Hispanic Community: Hispanic individuals are overrepresented among rape victims (39.3%) and robbery victims (43.5%) compared to their population share (29.1%). They also represent a considerable proportion of rape arrestees (40.7%) and robbery arrestees (32.2%).
- Black and Hispanic Communities combined: Black and Hispanic individuals represent a disproportionate majority of both victims and arrestees for major violent felonies, accounting for 75.1% of victims and 88.1% of arrestees, despite comprising only 49.4% of the population.
- Asian/Pacific Islander individuals have lower representation as both victims and arrestees in comparison to their population share (14.6%).
- White individuals are underrepresented as victims and arrestees in violent major felonies relative to their population share (31.2%).
- American Indian and Other categories show minimal representation in these statistics.
The data indicates that Black and Hispanic individuals are disproportionately affected as both victims and arrestees in all categories of violent major felonies, particularly in shootings. Asian/Pacific Islander and White individuals have a lower representation in both victim and arrestee statistics, which is somewhat proportional to their population percentages. American Indian individuals have the least representation, which correlates with their minimal population percentage in NYC.
Violent Major Felony Crime Victims
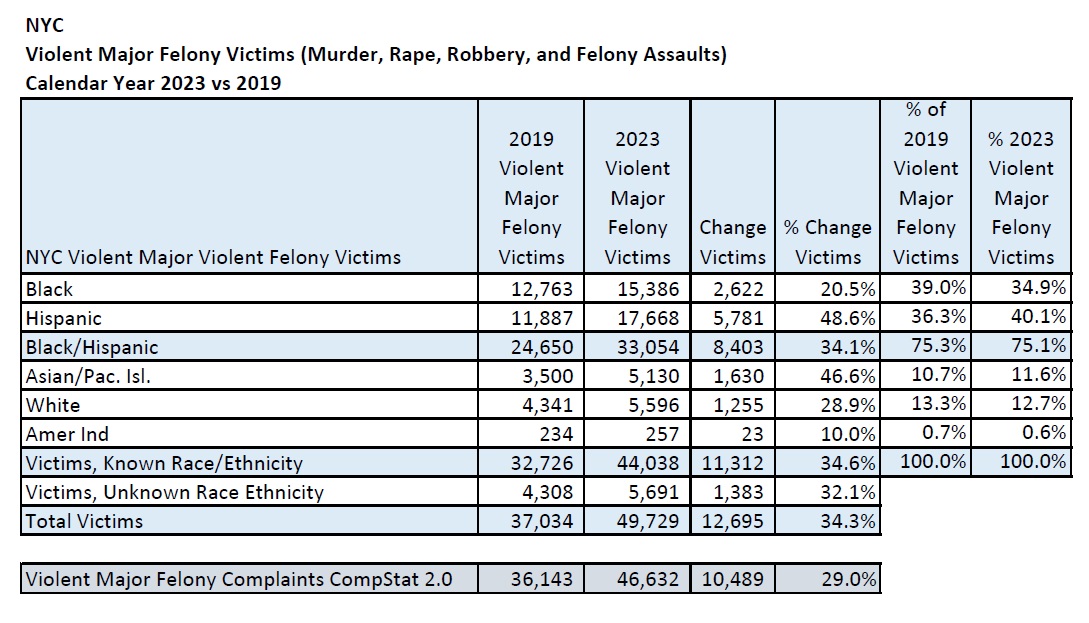
The table focuses on the known race and ethnicity of violent major felony victims in NYC in 2019 and 2023.
Here is a detailed analysis of the data for each group regarding violent major felony victims in NYC for 2019 and 2023:
- Black Community: In 2019, there were Black 12,763 victims, which rose to 15,386 in 2023, marking an increase of 2,622 victims or 20.5%. They made up 39.0% of the victims in 2019 and 34.9% in 2023.
- Hispanic Community: The number of Hispanic victims increased from 11,887 in 2019 to 17,668 in 2023, an increase of 5,781 victims or 48.6%. This group’s share of total victims increased from 36.3% in 2019 to 40.1% in 2023.
- Black and Hispanic Communities Combined: These groups consistently represented over three-quarters of the total victims, with 75.3% in 2019 and 75.1%.
- Asian/Pacific Islander Community: This group experienced a 46.6% surge in victimization, with their numbers climbing from 3,500 to 5,130, and their share of total victims increased from 10.7% in 2019 to 11.6% in 2023.
- White Community: The victim count rose from 4,341 in 2019 to 5,596 in 2023, an increase of 1,255 victims or 28.9%. They constituted 13.3% of the victims in 2019 and 12.7% in 2023.
- American Indian Community: A small increase was observed from 234 victims in 2019 to 257 in 2023, which is an increase of 23 victims or 10.0%. They accounted for 0.7% of the victims in 2019 and 0.6% in 2023.
Overall, there was a 34.3% increase in total violent major felony victims from 37,034 in 2019 to 49,729 in 2023. The data shows that although there was an increase in the number of victims across all groups, the Hispanic and Asian/Pacific Islander communities saw the most significant percentage increases, at 48.6% and 46.6% respectively. The Black and Hispanic communities continue to represent a significant majority of the victims in these categories. The Asian/Pacific Islander and White communities also saw notable increases, while the American Indian community had a relatively small change.
These figures highlight the importance of addressing disparities and ensuring that all communities receive the necessary support and resources to prevent and respond to violent crimes.
Murder
The table highlights the race/ethnicity of known murder victims for the years 2019 and 2023.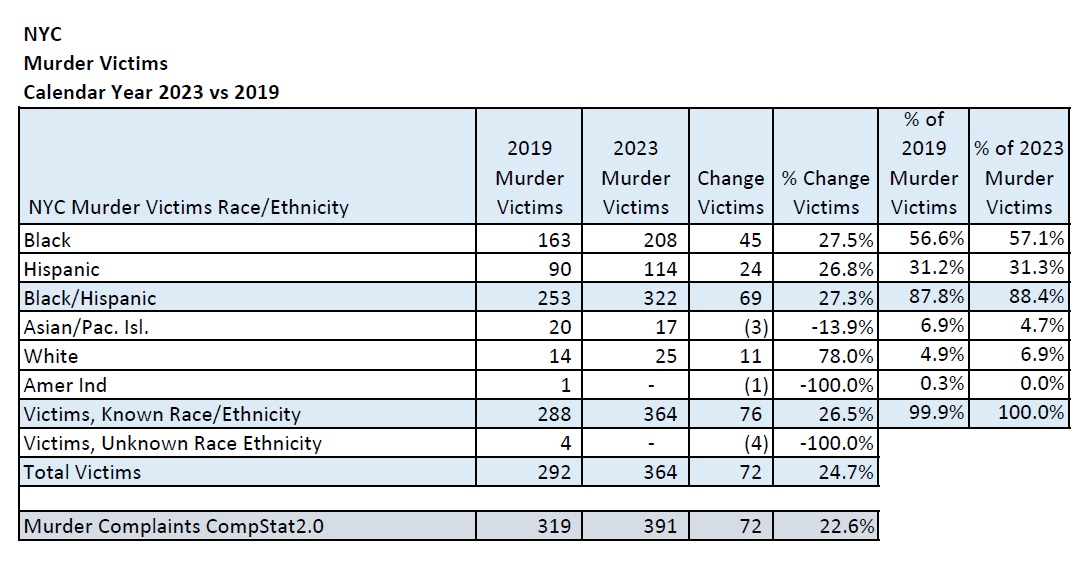
Here is an analysis of the data:
- Black Community: There was a 27.5% rise in the number of Black murder victims, increasing from 163 in 2019 to 208 in 2023. They made up 56.6% of the murder victims in 2019, which slightly increased to 57.1% in 2023.
- Hispanic Community: The Hispanic murder victims saw a 26.8% increase, with the count escalating from 90 to 114. Their proportion among murder victims marginally increased from 31.2% in 2019 to 31.3% in 2023.
- Combined Black and Hispanic Communities: Together, Black and Hispanic murder victims represented 87.8% of the murder victims in 2019 and this figure rose to 88.4% in 2023. This represents an overall increase of 27.3% in the number of victims.
- Asian/Pacific Islander Community: The number of murder victims in the Asian and Pacific Islander community decreased by 13.9%, falling from 20 in 2019 to 17 in 2023. Their share of murder victims also decreased from 6.9% to 4.7%.
- White Community: There was a significant 78.0% increase in the number of White murder victims, rising from 14 to 25. Their representation among murder victims also increased from 4.9% to 6.9%.
- American Indian Community: The number of Native American murder victims fell from 1 in 2019 to none in 2023.
In summary, between 2019 and 2023, there was a significant rise in the number of murder victims. Specifically, victims of known race/ethnicity saw a 26.5% increase, rising from 288 to 364. The total count of murder victims also rose by 24.7%, from 292 to 364. According to CompStat 2.0, Murder Complaints surged by 22.6%, from 319 in 2019 to 391 in 2023.
This data suggests a broad increase in murder victims across most racial and ethnic groups during this period. The most substantial percentage increase was observed among White individuals. Despite this, Black and Hispanic individuals remained the primary victims of murder. A decrease in victims from the Asian/Pacific Islander community was noteworthy, as was the total absence of victims from the American Indian community.
Rape
The table highlights the race/ethnicity of known rape victims for the years 2019 and 2023.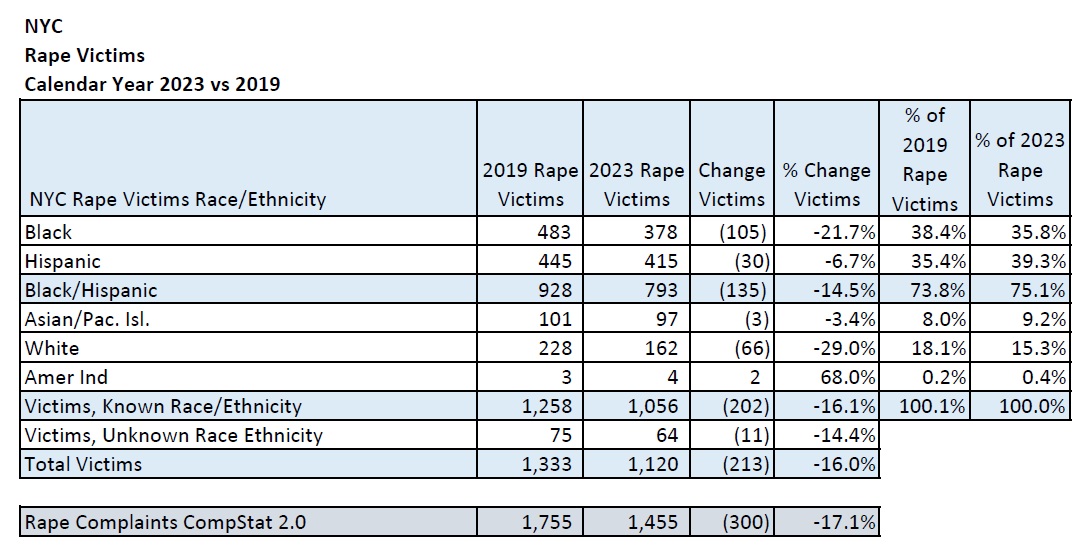
Here is an analysis of the data:
- Black Community: There was a decline of 21.7% in the number of Black rape victims, decreasing from 483 in 2019 to 378 in 2023. Their proportion of the total rape victims fell from 38.4% to 35.8%.
- Hispanic Community: Hispanic individuals saw a smaller decline of 6.7%, with the victim count reducing from 445 to 415. However, their share among rape victims rose from 35.4% in 2019 to 39.3% in 2023.
- Combined Black and Hispanic Communities: Together, Black and Hispanic individuals represented 73.8% of the rape victims in 2019 and this figure increased to 75.1% in 2023. This represents an overall decrease of 14.5% in the number of victims.
- Asian/Pacific Islander Community: The number of rape victims in the Asian and Pacific Islander community saw a minor decrease of 3.4%, falling from 101 in 2019 to 97 in 2023. However, their share of total rape victims also increased from 8.0% in 2019 to 9.2% in 2023.
- White Community: There was a significant 29.0% decrease in the number of White rape victims, falling from 228 in 2019 to 162 in 2023. Their representation among rape victims also decreased from 18.1% to 15.3%.
- American Indian Community: The number of Native American rape victims saw a notable percentage increase, albeit from a very small base, from 3 to 4 victims.
In general, there was a 16.1% decrease in rape victims of known race/ethnicity, from 1,258 in 2019 to 1,056 in 2023. Victims of unknown race/ethnicity also decreased by 14.4%, from 75 to 64. The total number of rape victims decreased by 16.0%, from 1,333 in 2019 to 1,120 in 2023. Rape Complaints, as per CompStat 2.0, decreased by 17.1% from 1,755 in 2019 to 1,455 in 2023.
This data suggests a general decrease in the number of rape victims across all racial and ethnic groups between 2019 and 2023, with the most significant percentage decrease observed among White individuals.
Robbery
The table highlights the race/ethnicity of known robbery victims for the years 2019 and 2023.
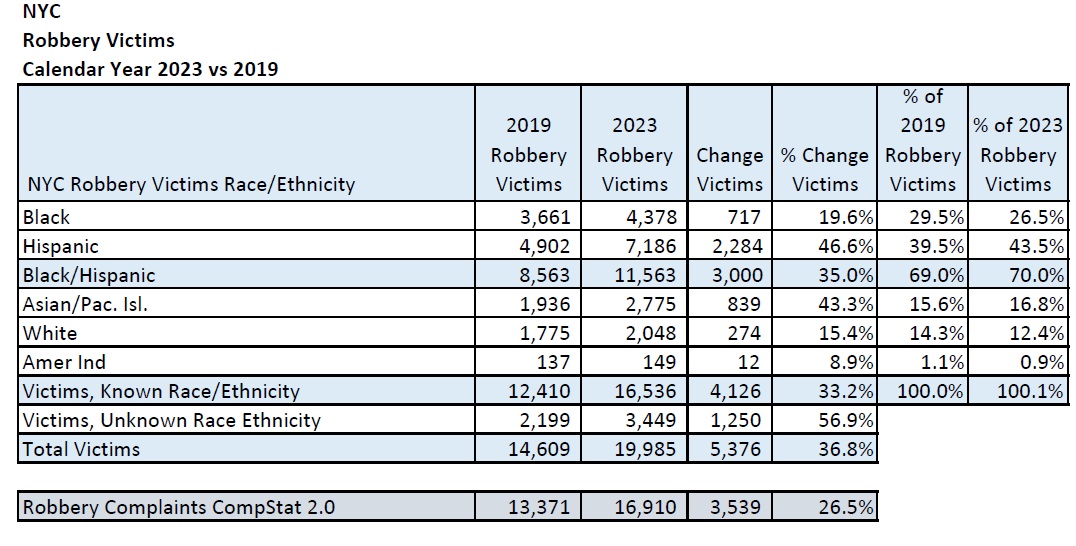
Here is an analysis of the data:
- Black Community: There was a 19.6% rise in robbery victimization among Black individuals, increasing from 3,661 victims in 2019 to 4,378 in 2023. Their proportion of total robbery victims fell from 29.5% to 26.5%.
- Hispanic Community: Hispanic individuals witnessed a substantial increase of 46.6%, with the victim count escalating from 4,902 to 7,186. Their share among robbery victims rose from 39.5% in 2019 to 43.5% in 2023.
- Combined Black and Hispanic Communities: Together, Black and Hispanic individuals represented 69.0% of the robbery victims in 2019 and this figure marginally increased to 70.0% in 2023. This represents an overall increase of 35.0% in the number of victims.
- Asian/Pacific Islander Community: The number of robbery victims in the Asian and Pacific Islander community saw a 43.3% increase, rising from 1,936 in 2019 to 2,775 in 2023. Their share of total robbery victims also increased from 15.6% in 2019 to 16.8% in 2023.
- White Community: There was a 15.4% increase in the number of White robbery victims, rising from 1,775 in 2019 to 2,048 in 2023. Their representation among robbery victims decreased from 14.3% to 12.4%.
- American Indian Community: The number of Native American robbery victims saw a small increase of 8.9%, from 137 in 2019 to 149 in 2023.
In general, there was a 33.2% increase in robbery victims of known race/ethnicity, from 12,410 in 2019 to 16,536 in 2023. Victims of unknown race/ethnicity also increased by 56.9%, from 2,199 to 3,449. The total number of robbery victims rose by 36.8%, from 14,609 in 2019 to 19,985 in 2023. Robbery Complaints, as per CompStat 2.0, increased by 26.5% from 13,371 in 2019 to 16,910 in 2023.
This data suggests a widespread increase in the number of robbery victims across all racial and ethnic groups from 2019 to 2023, with the highest percentage increase observed among Hispanic individuals (46.5%) followed by Asian/Pacific Islanders (43.3%).
Felony Assault
The table highlights the race/ethnicity of known felony assault victims for the years 2019 and 2023.
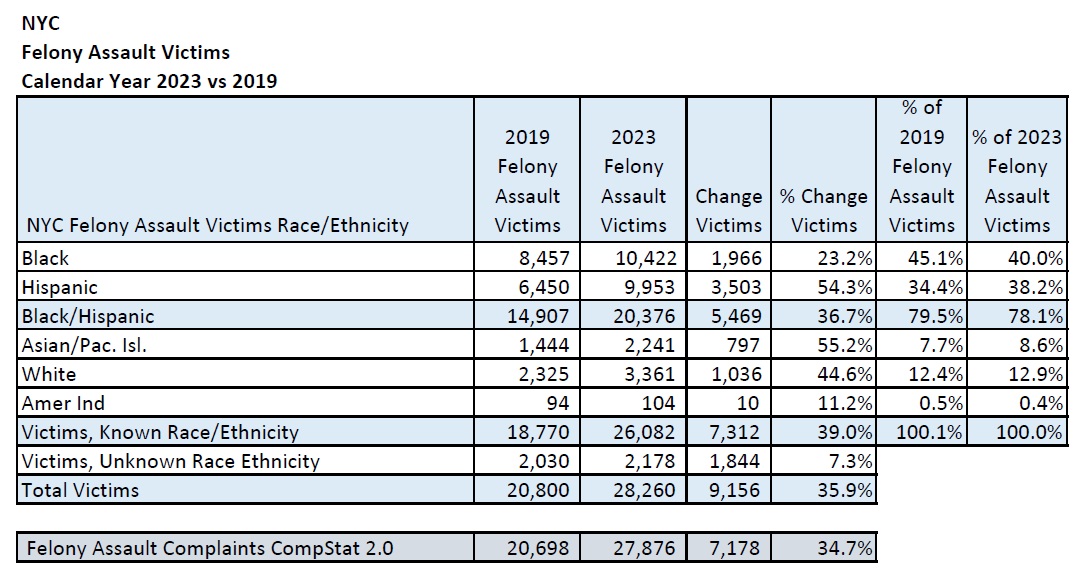
Here is an analysis of the data:
- Black Community: There was a 23.2% rise in felony assault victimization among Black individuals, increasing from 8,457 victims in 2019 to 10,422 in 2023. Their proportion of total felony assault victims fell from 45.1% to 40.0%.
- Hispanic Community: Hispanic individuals witnessed a substantial increase of 54.3%, with the victim count escalating from 6,450 to 9,953. Their share among felony assault victims rose from 34.4% in 2019 to 38.2% in 2023.
- Combined Black and Hispanic Communities: Together, Black and Hispanic individuals represented 79.5% of the felony assault victims in 2019 and this figure slightly decreased to 78.1% in 2023. This represents an overall increase of 36.7% in the number of victims.
- Asian/Pacific Islander Community: The number of felony assault victims in the Asian and Pacific Islander community saw a 55.2% increase, rising from 1,444 in 2019 to 2,241 in 2023. Their share of total felony assault victims also increased from 7.7% in 2019 to 8.6% in 2023.
- White Community: There was a 44.6% increase in the number of White felony assault victims, rising from 2,325 in 2019 to 3,361 in 2023. Their representation among felony assault victims increased from 12.4% to 12.9%.
- American Indian Community: The number of Native American felony assault victims saw a small increase of 11.2%, from 94 in 2019 to 104 in 2023.
In general, there was a 39.0% increase in felony assault victims of known race/ethnicity, from 18,770 in 2019 to 26,082 in 2023. Victims of unknown race/ethnicity also increased by 7.3%, from 2,030 to 2,178. The total number of felony assault victims rose by 35.9%, from 20,800 in 2019 to 28,260 in 2023. According to CompStat 2.0, felony assault complaints surged by 34.7% from 20,698 in 2019 to 27,876 in 2023.
The data indicates a significant rise in felony assault victims among all racial and ethnic groups from 2019 to 2023, with the most substantial percentage increases observed in Asian/Pacific Islander populations (55.2%), closely followed by Hispanic communities (54.3%).
Shootings
The table highlights the race/ethnicity of known shooting victims for the years 2019 and 2023.
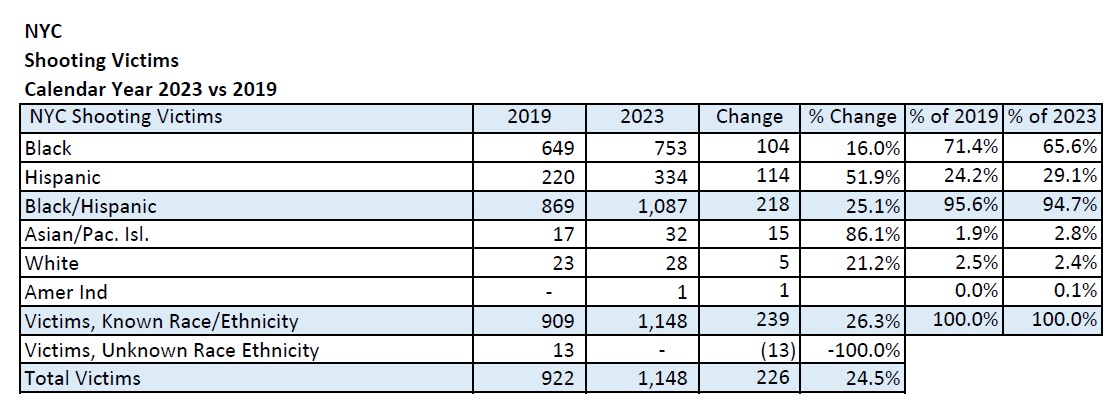
Here is an analysis of the data:
- Black Individuals: The number of Black shooting victims rose from 649 in 2019 to 753 in 2023, marking a 16.0% increase. Their proportion among total victims decreased from 71.4% in 2019 to 65.6% in 2023.
- Hispanic Individuals: The count of Hispanic shooting victims saw a significant rise of 51.9%, increasing from 220 in 2019 to 334 in 2023. Their representation among total victims increased from 24.2% in 2019 to 29.1% in 2023.
- Combined Black and Hispanic Individuals: This group experienced a 25.1% rise in shooting victims, from 869 in 2019 to 1,087 in 2023. They accounted for 95.6% of the victims in 2019 and 94.7% in 2023.
- Asian/Pacific Islander Individuals: The number of Asian/Pacific Islander shooting victims increased by 86.1%, from 17 in 2019 to 32 in 2023. Their share among total victims increased from 1.9% in 2019 to 2.8% in 2023.
- White Individuals: The number of White shooting victims saw a 21.2% increase, from 23 in 2019 to 28 in 2023. Their proportion among total victims slightly decreased from 2.5% in 2019 to 2.4% in 2023.
- American Indian Individuals: There was 1 American Indian shooting victim in 2023, up from none in 2019.
- Known Race/Ethnicity: The total number of shooting victims of known race/ethnicity rose by 26.3%, from 909 in 2019 to 1,148 in 2023.
- Unknown Race/Ethnicity: The number of shooting victims in this category decreased from 13 in 2019 to none in 2023.
- Total Shooting Victims: The total number of shooting victims increased by 24.5%, from 922 in 2019 to 1,148 in 2023.
This data indicates an overall rise in the number of shooting victims in NYC from 2019 to 2023 across all racial/ethnic groups, with the exception of the “Unknown Race Ethnicity” category, which saw a decrease. The most significant percentage increase was observed in the Asian/Pacific Islander group, while the largest absolute increase was seen in the Black/Hispanic group. However, it is noteworthy that the Black and Hispanic groups continued to constitute the majority of shooting victims in both years.
Police Stop, Question, and Frisk
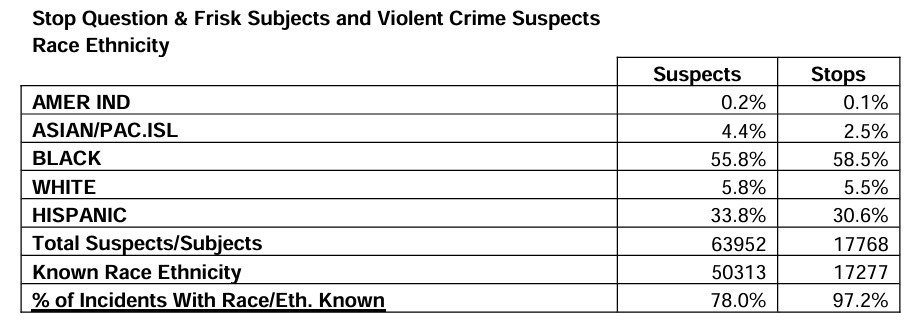
The NYPD Stop/Question/Frisk statistics initially seem confusing because the individual percentages for each racial/ethnic group’s stops in 2023 sum up to only 97.2%, not the complete 100%. The NYPD’s standard practice is to calculate these percentages relative to the total number of incidents where the race/ethnicity of individuals is known. Therefore, the individual percentages for each group should collectively equal 100%, not 97.2%. To address this discrepancy, I recalculated the percentages for each racial/ethnic category, using the published percentage for each group as the numerator and 97.2% as the denominator. It appears there was a miscalculation by the NYPD, as they seem to have used the total number of incidents, including those with unknown race/ethnicity, as the denominator. Interestingly, the percentage of incidents with known race/ethnicity is also 97.2%, as shown in the table below. However, this figure is derived by dividing the total number of incidents where race/ethnicity is known by the total number of incidents, which includes those with unknown race/ethnicity.
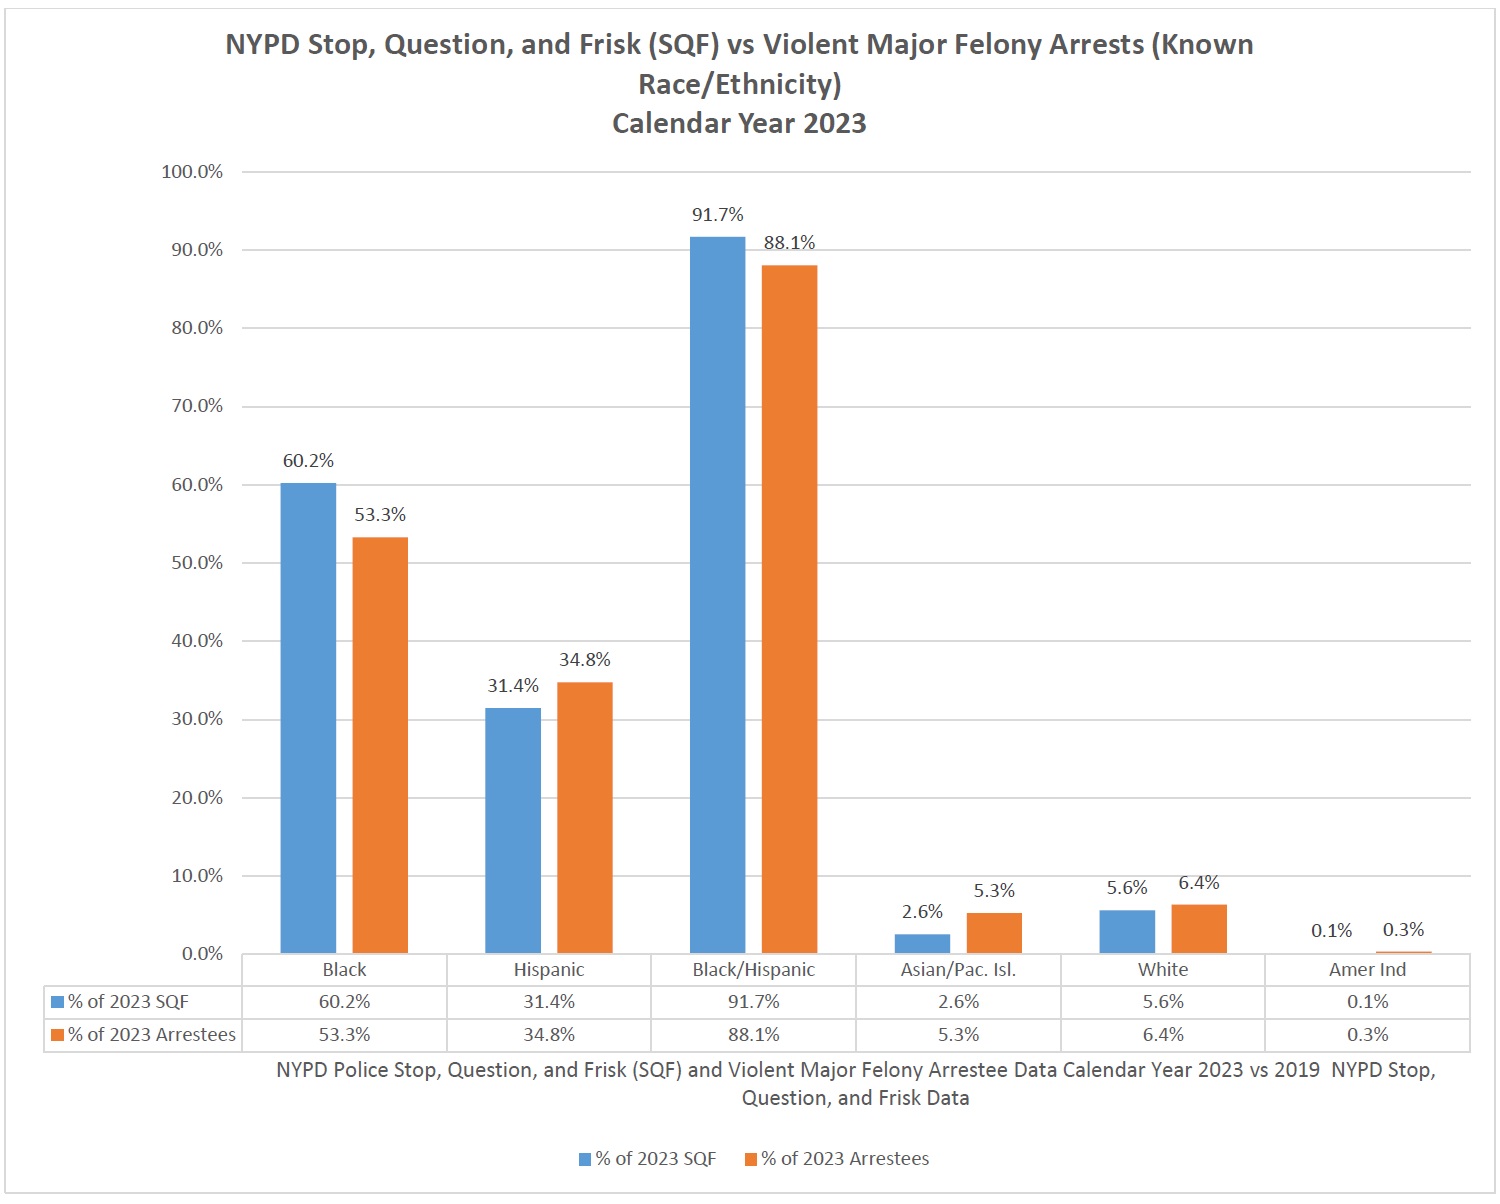
The data below offers a comparison of the NYPD’s Stop, Question, and Frisk (SQF) incidents and arrests for violent major felony crimes across various known racial and ethnic groups from 2019 to 2023.
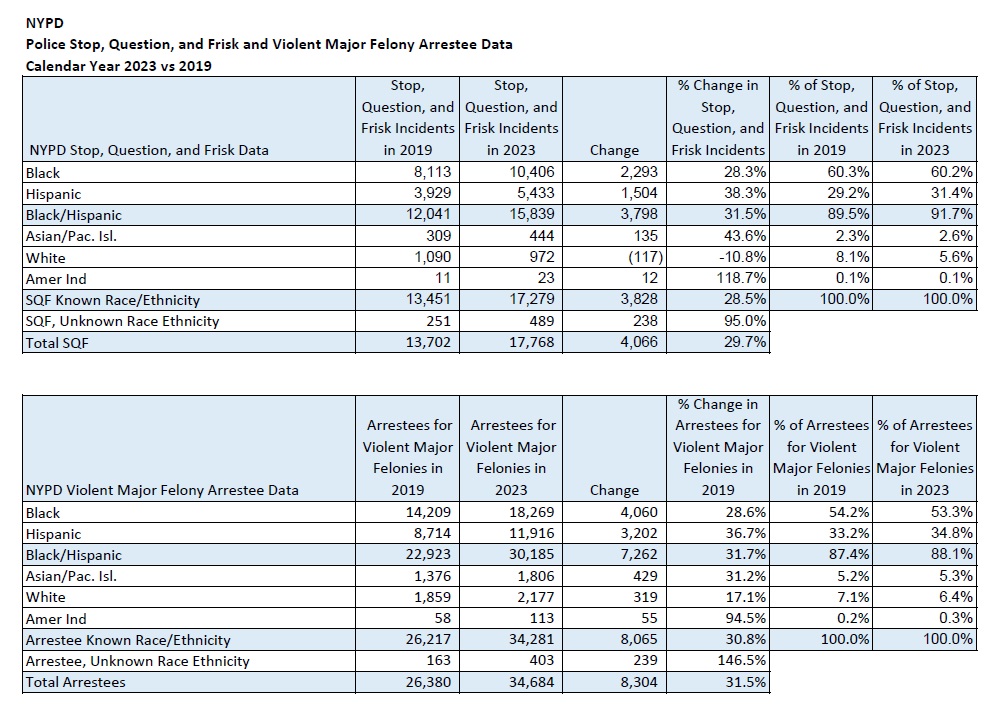
Here is a restructured analysis of the relationship between SQF incidents and arrests for violent major felonies:
- Black Community: There was a 28.3% increase in stop, question, and frisk incidents within the Black community, paralleled by a 28.6% rise in arrests for violent major felonies.
- This data implies a direct correlation between the surge in stop, question, and frisk incidents and arrests in this community.
- Hispanic Community: The Hispanic community experienced a 38.3% surge in stop, question, and frisk incidents, alongside a 36.7% increase in arrests for violent major felonies.
- The simultaneous rise in these percentages suggests a link between stop, question, and frisk incidents and felony arrests.
- Combined Black and Hispanic Communities: In 2019, Black and Hispanic individuals accounted for 89.5% of stop, question, and frisk incidents, and 87.4% of arrests for violent major felonies. By 2023, these percentages rose to 91.6% for stops and 88.1% for arrests. The simultaneous increase in these percentages suggests a correlation between stop, question, and frisk incidents and felony arrests.
- Asian/Pacific Islander Community: This group saw the largest percentage increase in stop, question, and frisk incidents at 43.6%, along with a 31.2% rise in arrests for violent major felonies. The notable increase in both metrics suggests an escalation in both policing activity and crime rates.
- White Community: The White community experienced a 10.8% decrease in stop, question, and frisk incidents, but a 17.1% increase in arrests for violent major felonies. The decline in stop, question, and frisk incidents contrasts with the rise in arrests, potentially reflecting changes in crime patterns or shifts in policing strategies.
- American Indian Community: Despite representing a small percentage of the total, the American Indian community saw significant increases in both stop, question, and frisk incidents (118.7%) and arrests (94.5%). These substantial increases could suggest increased police attention or a rise in crime rates within this demographic.
- Known and Unknown Race/Ethnicity: Individuals of known race/ethnicity experienced a 28.5% increase in stop, question, and frisk incidents, and a 30.8% rise in arrests for violent major felonies. Those of unknown race/ethnicity saw a 95.0% increase in stop, question, and frisk incidents, and a 146.5% surge in arrests for violent major felonies.
In total, the number of stop, question, and frisk incidents rose by 29.7%, while arrests for violent major felonies across all categories increased by 31.5%.
The data shows that for most racial groups, there is an increase in stop, question, and frisk incidents and arrests for violent major felonies, with the Black and Hispanic communities being the most impacted. The correlation between stop, question, and frisk incidents and violent major felony arrests suggest that the NYPD’s stop-and-frisk practices align with the demographics of crime perpetrators, which is the intended outcome.
Racial and Ethnic Composition of NYPD
The data below shows the race/ethnicity of the NYPD, comparing 2019 and 2023, with a focus on the change in numbers and percentages across different racial and ethnic groups.
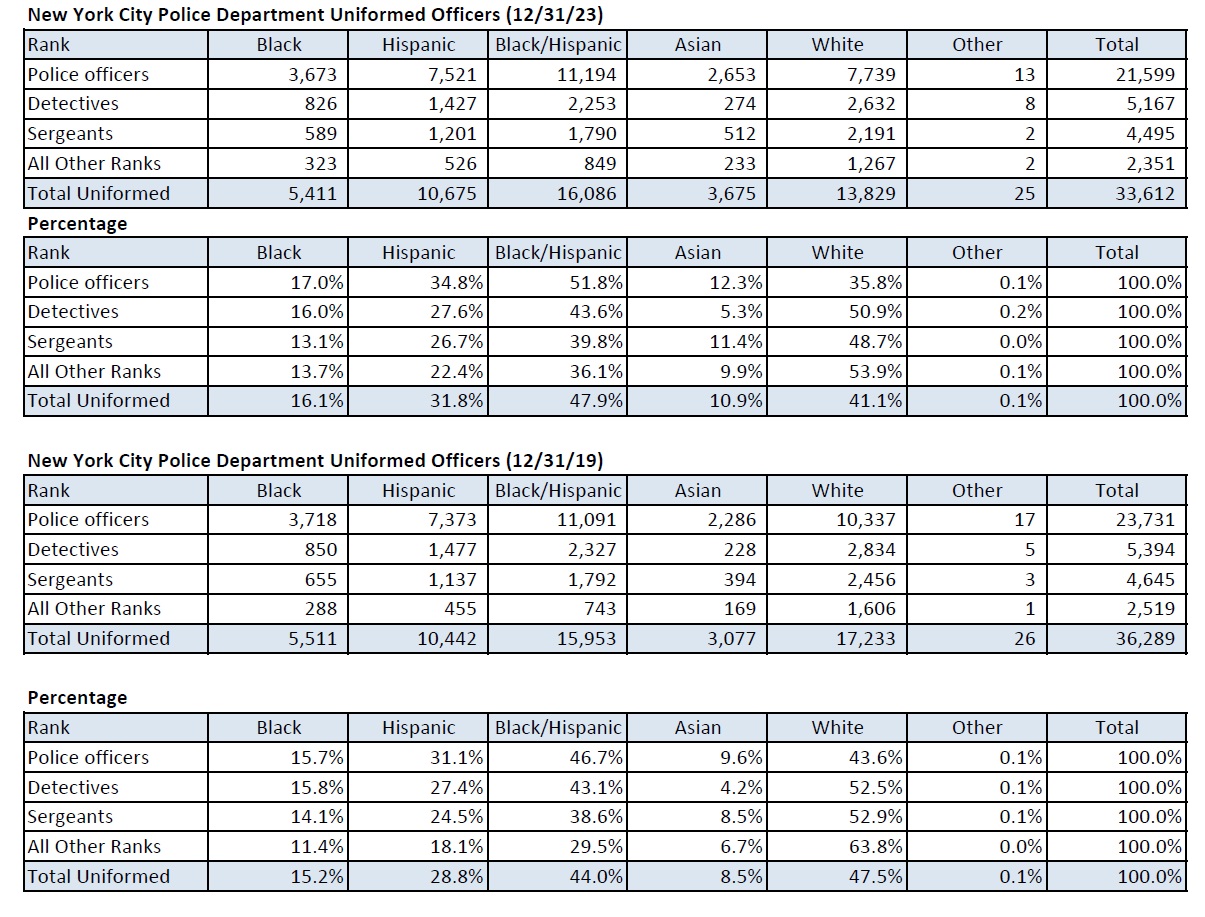
The data on the racial and ethnic composition of the New York City Police Department’s uniformed officers as of December 31, 2023, shows the following distribution:
- Police officers: 17.0% Black, 34.8% Hispanic, 12.3% Asian, 35.8% White, and 0.1% Other.
- Detectives: 16.0% Black, 27.6% Hispanic, 5.3% Asian, 50.9% White, and 0.2% Other.
- Sergeants: 13.1% Black, 26.7% Hispanic, 11.4% Asian, 48.7% White, and 0.0% Other.
- All Other Ranks: 13.7% Black, 22.4% Hispanic, 9.9% Asian, 53.9% White, 0.1% Other.
- Total Uniformed: 16.1% Black, 31.8% Hispanic, 10.9% Asian, 41.1% White, and 0.1% Other.
Comparing these figures to the data from December 31, 2019, we observe the following changes:
- Black Individuals: A slight increase in the percentage of officers, from 15.2% to 16.1% of the total uniformed force.
- Hispanic Individuals: An increase in the percentage of officers, from 28.8% to 31.8% of the total uniformed force.
- Black/Hispanic Combined: An increase in the percentage of officers, from 44.0% to 47.9% of the total uniformed force.
- Asian Individuals: An increase in the percentage of officers, from 8.5% to 10.9% of the total uniformed force.
- White Individuals: A decrease in the percentage of officers across all ranks, with the total uniformed officers dropping from 47.5% to 41.1%.
- Other Individuals: The percentage of officers categorized as Other remains relatively unchanged.
Overall, the data shows a trend towards a more diverse police force over the four-year period, with a notable increase in Hispanic and Asian representation among the uniformed officers. The decrease in the percentage of White officers suggests a shift in the demographic makeup of the NYPD, aligning more closely with the diverse population of New York City.
Relationship between NYPD Personnel Reductions and Violent Major Felonies
The table shows a statistical analysis of violent major felony crimes in NYC in 2019 and 2023, with a focus on the change in the number of victims by race/ethnicity and the corresponding reduction in NYPD officers.
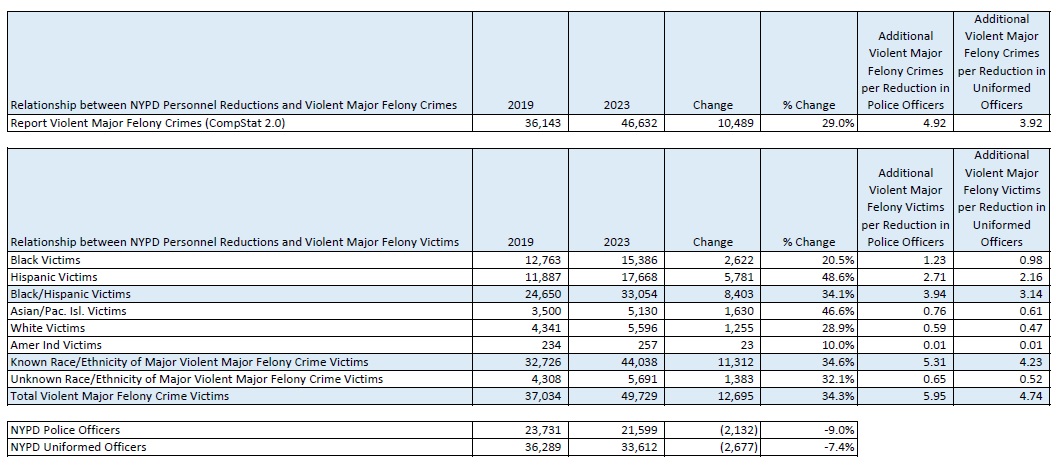
Here is an analysis of the data:
In 2023, the incidence of violent major felonies surged by 29.0%, resulting in an additional 10,489 incidents compared to 2019. Simultaneously, the number of individuals affected by these felonies rose by 34.3%, with 12,695 more victims than in 2019. During this period, the NYPD’s workforce experienced a decline, losing 2,132 police officers and 2,677 uniformed officers, representing declines of 9.0% and 7.4%, respectively.
The data reveals that for each eliminated officer position, there was an increase of approximately 4.92 victims of violent major felonies, and about 3.92 more victims for every uniformed officer position cut. The most pronounced impact of the reduced police force was felt within the Black and Hispanic populations, where there was an uptick of 3.94 violent major felony victims for each police officer reduction, and 3.14 more victims correlating with each decrease in uniformed officers.
These findings suggest a strong correlation between the decrease in law enforcement personnel and the rise in victims of violent major felonies. The Black and Hispanic communities were most affected by the NYPD personnel reductions.
*STATISTICAL NOTE
The source of most statistical data for this analysis was the NYPD Crime and Enforcement Activity Reports for the years 2023 and 2019. These reports provide crime statistics, including information on both known and unknown race/ethnicity of victims, suspects, and arrestees.
It is important to acknowledge that in some cases, the reported percentages may not add up to exactly 100%. However, these minor discrepancies do not significantly change the overall interpretation of the data. Additionally, I derived headcount numbers from the provided percentages, which may result in slight variations in the figures.
Furthermore, it is worth noting that the total counts for victims and arrestees may not align precisely with the complaint figures reported in the NYPD CompStat reports. This discrepancy arises because CompStat is based on the number of reported incidents, and a single crime can involve multiple victims and perpetrators.
Written by,
Sam Antar
© Copyright by Sam Antar. All rights reserved.
Recommended Reading: NYC Politicians Misuse Crime and Incarceration Statistics to Further Their Agendas