Pick any year. The answer doesn’t change.
Every year since 2018, Black New Yorkers have appeared as victims of murder, rape, robbery and felony assault combined at more than four times the White rate in NYPD’s own complaint records. Hispanic New Yorkers: roughly three times.
For murder, it’s worse. In every full year from 2018 through 2025, Black New Yorkers were murder victims at approximately 10 to 17 times the White rate. Hispanic New Yorkers: approximately 3 to 7 times.
Among the four groups analyzed here, Black and Hispanic New Yorkers are half the population. In the first half of 2026, they were three of every four victim records.
The first-half comparison also shows a wider gap than in 2019. In the first half of 2026, the Black multiple hit 4.68 and the Hispanic multiple 3.27. In the same months of 2019, the last year before the bail law changes and the pandemic, they were 4.37 and 2.90. That widening holds under most of the tests below, though not all of them; the disparity itself holds under every one.
All of this while the NYPD touted the fewest first-half murders in the city’s recorded history. Murder fell. Assault didn’t.
In the first six months of 2026, the four groups logged 19,657 complaint records for the four core violent crimes, 5,126 more than in the same months of 2019, an increase of 35 percent. Felony assault drove much of it: 13,380 records in six months, 50 percent above 2019. For every murder record, there were 117 felony assault records.
And no group was spared. From 2019 to 2025, using the main population series, every group’s recorded rate rose by more than a quarter, White New Yorkers included.
The rise spans four chapters of the city’s recent history: Letitia James’s tenure as attorney general, which began January 1, 2019; the bail law changes that took effect a year later; Kathy Hochul’s tenure as governor, which began August 24, 2021; and Mayor Zohran Mamdani’s first six months in office. The records cannot say who or what caused it. They can say, precisely, who bore it.
These figures count NYPD complaint records, not unique people, and describe victims, not offenders. The main population series uses Census survey estimates; an alternative Census series is tested below. See the note at the end.
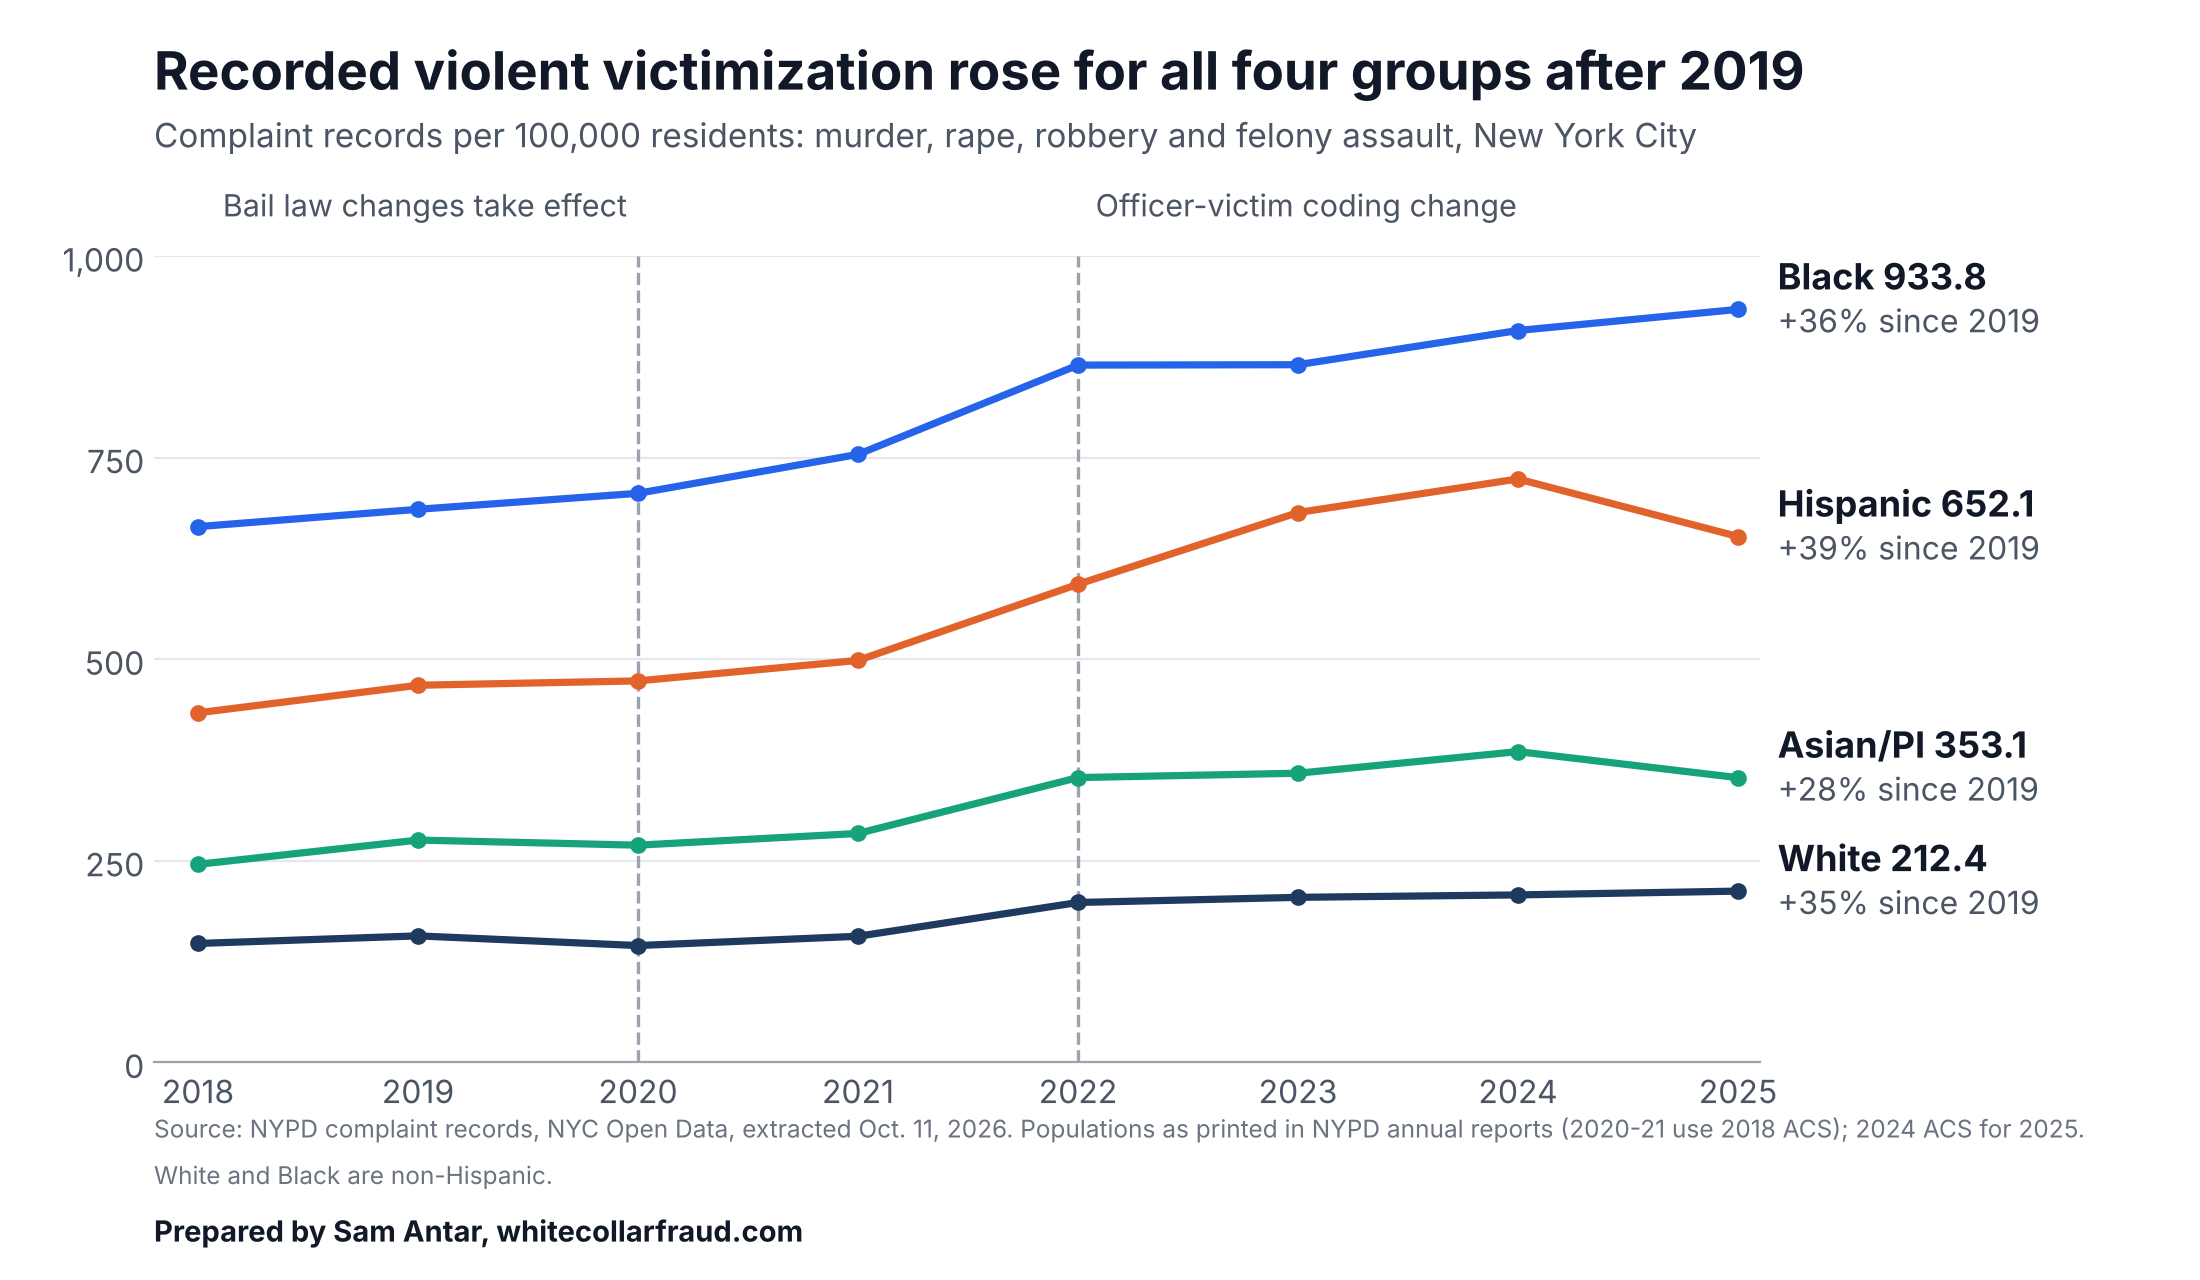
The Gap That Never Closes
In every year since 2018, Black New Yorkers have had the highest combined recorded rate of the four groups analyzed, and Hispanic New Yorkers the second highest.
Pick any of the four crimes in 2025. The same: Black residents had the highest recorded rate of the four groups for murder, for rape, for robbery and for felony assault. The disparity was widest where the stakes are highest: Black New Yorkers appeared as murder victims at 12.5 times the White rate.
Recorded rate as a multiple of the White rate, full year 2025
| Offense | Black | Hispanic | Asian/Pacific Islander |
|---|---|---|---|
| Murder | 12.54 | 5.24 | 0.96 |
| Rape | 3.75 | 2.30 | 0.85 |
| Robbery | 3.90 | 3.71 | 2.48 |
| Felony assault | 4.61 | 2.85 | 1.38 |
| Four offenses combined | 4.40 | 3.07 | 1.66 |
The murder multiples rest on small White counts, 14 to 27 White murder records a year, so they swing from year to year: from 10 to 17 for Black New Yorkers. The pattern does not depend on it. Robbery, rape and felony assault tell the same story.
One comparison makes the point plainly. In 2025, Black and Hispanic New Yorkers generated almost exactly the same number of complaint records: 15,809 and 15,848. But there are about 30 percent fewer Black New Yorkers than Hispanic New Yorkers. The same number of records, spread across a smaller population, produces a far higher rate.
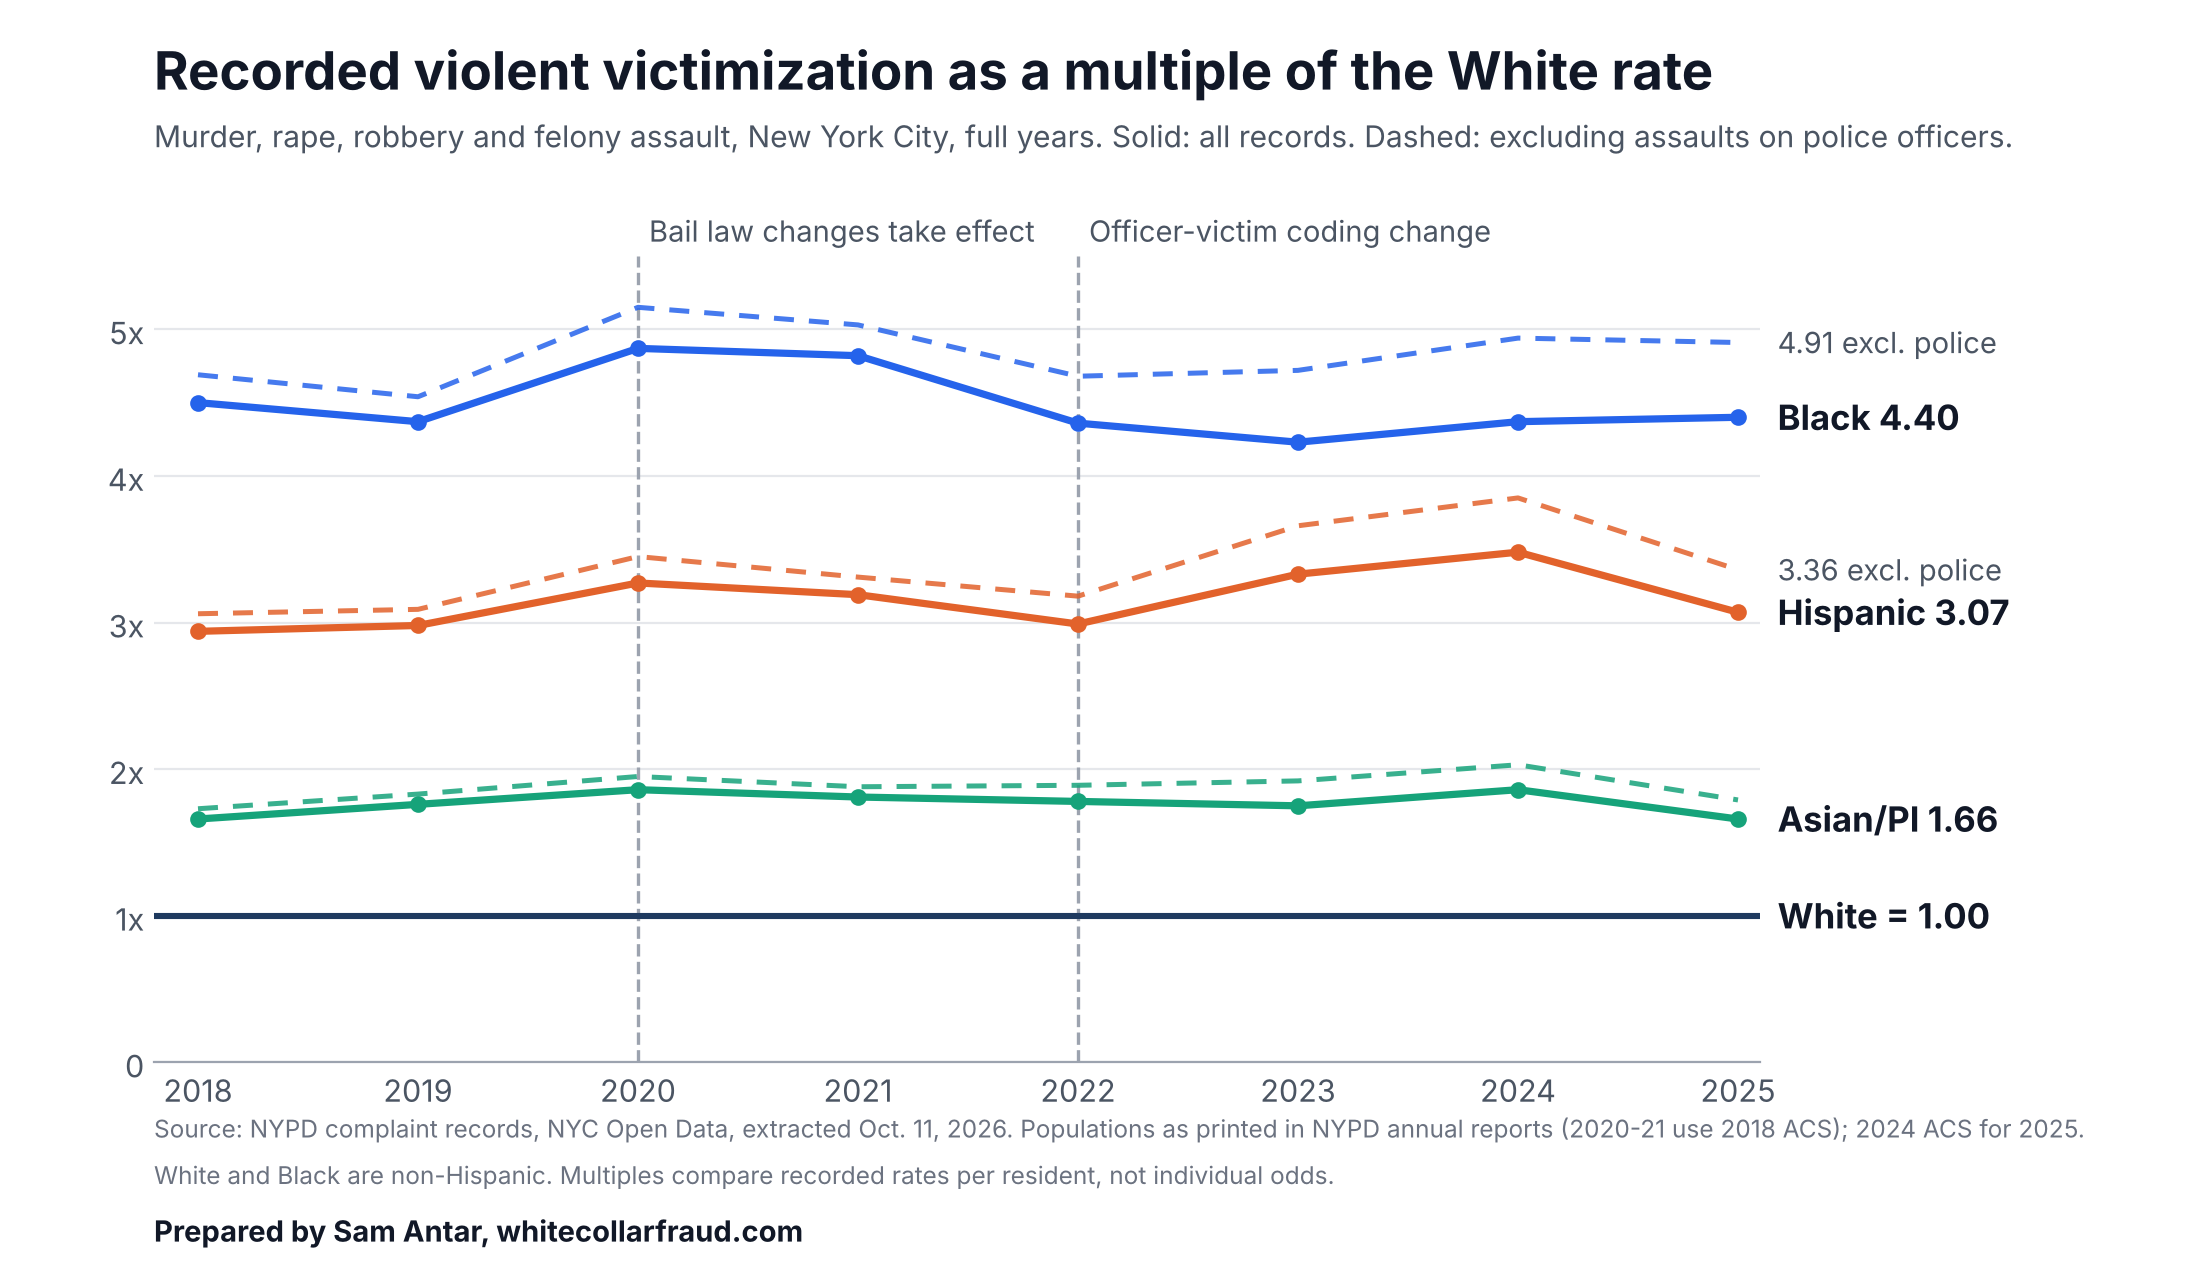
Here is every group’s recorded rate, and how many times the White rate it is, for every year since 2018, the last full year before Letitia James took office.
| Group and measure | 2018 | 2019 | 2020 | 2021 | 2022 | 2023 | 2024 | 2025 |
|---|---|---|---|---|---|---|---|---|
| White: rate per 100k | 147.5 | 156.9 | 144.9 | 156.4 | 198.3 | 204.7 | 207.7 | 212.4 |
| White: times White rate | 1.00 | 1.00 | 1.00 | 1.00 | 1.00 | 1.00 | 1.00 | 1.00 |
| Black: rate per 100k | 664.4 | 685.9 | 705.7 | 754.0 | 864.7 | 865.2 | 907.6 | 933.8 |
| Black: times White rate | 4.50 | 4.37 | 4.87 | 4.82 | 4.36 | 4.23 | 4.37 | 4.40 |
| Hispanic: rate per 100k | 433.5 | 467.7 | 473.1 | 498.5 | 592.9 | 681.9 | 723.5 | 652.1 |
| Hispanic: times White rate | 2.94 | 2.98 | 3.27 | 3.19 | 2.99 | 3.33 | 3.48 | 3.07 |
| Asian/Pacific Islander: rate per 100k | 245.6 | 275.7 | 269.4 | 283.9 | 353.2 | 358.6 | 385.4 | 353.1 |
| Asian/Pacific Islander: times White rate | 1.66 | 1.76 | 1.86 | 1.81 | 1.78 | 1.75 | 1.86 | 1.66 |
| Black: times White rate, excluding police assaults | 4.69 | 4.54 | 5.15 | 5.03 | 4.68 | 4.72 | 4.94 | 4.91 |
The gap is not a straight line. The Black multiple rose to 4.87 in 2020, the year the White rate dipped while the Black rate rose, and fell back after 2022. With all records, it was 4.50 in 2018 and 4.40 in 2025, which looks like a small improvement. It isn’t. Starting in 2022, NYPD’s records show a substantial change in how the race of assaulted police officers was recorded, adding more of those records to the race-specific counts, particularly for White victims. Remove assaults on police officers in every year, and the Black multiple rose instead: from 4.69 in 2018 and 4.54 in 2019 to 4.91 in 2025.
Against 2019, the gap is wider on both counts with published populations, and the increase is larger in the matched first-half comparison: 4.37 in 2019, 4.68 in 2026.
How population estimates affect these numbers
Every rate here divides complaint records by a Census population estimate. Change the estimate and the rate changes, even if not one crime record does. The estimates moved in ways that cut in opposite directions, and neither side should claim them.
The overall rise. The 2018 and 2019 rates rest on estimates made before the 2020 census, and the Census Bureau’s estimate for 2020 came in about 521,000 people below the census count, according to the city’s planners. If the baseline populations were too small, the baseline rates were too high, and the increases since then are understated, not overstated. Complaint counts alone, with no population estimates involved, rose for every group.
The Black-White gap. Here the estimates work the other way. Later estimates show the Black population shrinking faster than the White population, for reasons that can include real population shifts and changes in how race is asked and coded. A shrinking Black estimate pushes the Black multiple up. That makes the widening the most sensitive finding in this article.
The census itself. The Census Bureau’s own audit of the 2020 count found Black and Hispanic residents undercounted nationally, by 3.3 and 5.0 percent, and non-Hispanic White residents overcounted by 1.6 percent. Apply those national percentages hypothetically to the populations used here, and the Black multiple in the first half of 2026 would fall from 4.68 to about 4.45. Those are not NYC-specific adjustments. Even under that assumption, the gap remains substantial.
Three tests
Fixed populations. Hold every group’s population at its 2024 level, so only complaint counts can move the result. The first-half gap still widens: from 4.58 in 2019 to 4.68 in 2026, or from 4.78 to 5.25 excluding police assaults. Most of the rise from 4.37 to 4.68 comes from the changing estimates; the part driven by complaint counts alone is smaller but still there. On a full-year basis with all records, the gap does not widen at fixed populations: 4.58 in 2019, 4.40 in 2025.
The newest Census series. The Census Bureau’s Vintage 2025 series is a different product from the survey estimates in the main series, built with different methods, so it is a check, not a replacement. The test keeps the main series’ populations for 2018 and 2019 and uses Vintage 2025 for 2020 through 2025, so its comparisons with 2019 cross that boundary; its fixed-population tests do not. Under it, the disparity persists: the Black multiple stays above 4.2 every year, and the Hispanic multiple stays near three times the White rate. With 2025 populations held fixed, the first-half gap still widens, from 4.53 in 2019 to 4.63 in 2026, or from 4.73 to 5.19 excluding police assaults.
Other results change under that series. The full-year Black multiple edges down, from 4.37 in 2019 to 4.35 in 2025, a comparison that crosses the boundary. The Black rate dips between 2022 and 2023 instead of rising or holding every year, and the Hispanic rate dips between 2023 and 2024. And the series counts many more Asian/Pacific Islander residents, for reasons the two methods do not let us separate, so that group’s increase since 2019 shrinks to about 13 percent. The data appendix shows every alternative figure.
Records with no race recorded. About 5 to 6 percent of records in each period checked carry no race. They cannot be assigned to a group, so the main analysis leaves them out. Add them back, and the overall increase is about the same: complaint records rose 37 percent from the first half of 2019 to the first half of 2026, and 33 percent from 2019 to 2025. Then take the most extreme assumption, that every unknown-race record was a White victim. Black New Yorkers’ recorded rate would still be about three times the White rate in every period tested, and Hispanic New Yorkers’ about twice. Under that assumption, the first-half gap would not widen: 3.19 in 2019, 3.13 in 2026.
What no test changes. Black New Yorkers’ recorded rate is more than four times the White rate in every year since 2018 under the published figures, and at least three times under every test in this article.
These multiples compare recorded rates per resident, not any one person’s odds. But they describe a city in which the burden of violent crime has fallen, year after year, hardest on the same people.
Source: NYC Open Data, NYPD Complaint Data Historic and Current Year to Date, extracted October 11, 2026; population figures from NYPD annual reports and the 2024 American Community Survey.
Murder Fell. Assault Didn’t.
NYPD reported 122 murders in the first half of 2026, the fewest on record for that period. Shootings also hit a record low.
But murder is the rarest of the four violent crimes. In the first half of 2026, the four groups logged 114 murder complaint records. They logged 13,380 for felony assault.
NYPD called reported felony assaults “virtually flat” for the first half of the year. Against 2025, they were. Against 2019, they were not.
By my comparison of NYPD’s own contemporaneously published September releases, reported felony assaults for January through September rose 46.2 percent from 2019 to 2026, from 15,583 to 22,781. Those are counts of reported crimes, not victims, and they are not broken out by race.
The victim records point the same way: among the four groups analyzed, felony assault complaint records rose 50 percent from the first half of 2019 to the first half of 2026.
- White: up 54%
- Black: up 36%
- Hispanic: up 58%
- Asian/Pacific Islander: up 94%
Even the murder decline was not shared evenly. Compared with the first half of 2019, Black murder records fell from 74 to 62. Hispanic murder records rose from 33 to 37.
Source: NYPD, first-half 2026 crime release, July 2, 2026; NYPD September 2019 and September 2026 crime releases (reported crimes, author’s calculations); NYC Open Data, offense codes 101 and 106.
Seven Years, Every Group Higher
Letitia James took office as attorney general on January 1, 2019. That makes 2018 the last full year before her tenure. New York’s bail law changes, passed in April 2019, took effect in January 2020, and within weeks the pandemic arrived. That makes 2019 the last full year before both. Here is what the full-year records show:
| Group | 2018 rate per 100k | 2019 rate per 100k | 2025 rate per 100k | Change since 2018 | Change since 2019 |
|---|---|---|---|---|---|
| White | 147.5 | 156.9 | 212.4 | +43.9% | +35.4% |
| Black | 664.4 | 685.9 | 933.8 | +40.5% | +36.1% |
| Hispanic | 433.5 | 467.7 | 652.1 | +50.4% | +39.4% |
| Asian/Pacific Islander | 245.6 | 275.7 | 353.1 | +43.7% | +28.1% |
Using the main population series, every group is up by 40 percent or more since 2018, the last full year before James took office, and by more than a quarter since 2019.
The climb does not depend on one data source. NYPD’s own annual demographic reports, compiled separately, show the same direction from 2018 to 2024. It does not depend on shifting Census estimates either: holding each group’s population fixed at its 2024 level, every group is still above both 2018 and 2019.
Population estimates add a second uncertainty. The Census Bureau’s estimate of the city’s population in 2020 came in about 521,000 below the 2020 census count, according to the city’s Department of City Planning. If the populations behind the 2018 and 2019 rates were similarly understated, those rates would be overstated, and the increases since then larger than shown here. But that citywide gap does not show how far off each group’s earlier estimate was, so the rates here stand as calculated.
In the main series, apart from a one-year dip in 2020 for White and Asian/Pacific Islander residents, the only declines came in 2025, when Hispanic and Asian/Pacific Islander rates fell about 10 and 8 percent, led by sharp drops in robbery. The Black rate never fell. It rose, or held flat, in every year of the series.
Kathy Hochul became governor on August 24, 2021, which makes 2020 the last full year before her tenure. She signed amendments to the bail law in 2022 and again in 2023 that gave judges more discretion to set bail.
Measured from that 2020 baseline, a span that includes the months before she took office, every group’s recorded rate rose by 2025: White 46.6 percent, Black 32.3 percent, Hispanic 37.8 percent, Asian/Pacific Islander 31.1 percent. Excluding police assaults, every group is still up 26 to 37 percent.
Measured from 2021, the year she took office, the result holds: every group’s rate rose by 2025, by 24 to 36 percent, or 19 to 27 percent excluding police assaults, though the Black-White gap was narrower in 2025 than in 2021 on both bases.
One caution: 2020 was a pandemic year, when the White and Asian/Pacific Islander rates dipped while the Black rate rose. That makes their later increases look larger, and it makes 2020’s Black-White gap, 4.87, unusually wide. By 2025 it was 4.40.
All three officials have stood behind the bail law in public, to different degrees. When it took effect in January 2020, James’s office said she “strongly supports the spirit of the criminal justice reforms. Full stop,” while allowing that the law could be revisited.
Hochul signed both rounds of rollbacks, but in August 2022 she said, “I’ve yet to see data that shows a correlation with a net increase in crime and the bail laws.”
Mamdani supports the law, WNYC reported in November 2025, while Jessica Tisch, the police commissioner he chose to keep, has blamed it for the post-pandemic rise in crime.
Responsibility needs precision. All three have publicly backed the bail law, Hochul even while signing rollbacks to it. But backing a law is not running a police department.
The attorney general does not run the NYPD, set bail or prosecute most street crime. The governor signs bail laws but does not run the NYPD either. The mayor runs the NYPD. Judges make bail decisions, and the five elected district attorneys prosecute most street crime.
These records show what happened during James’s and Hochul’s tenures and after the bail law changes, not what any of them caused. Proving cause would take evidence these records do not contain.
Source: NYC Open Data complaint records; NYPD Crime and Enforcement Activity reports, 2018 and 2024; Office of the Attorney General, January 1, 2019; Office of the Governor, August 24, 2021.
Mamdani’s Six Months: Better, Not Fixed
Mayor Mamdani’s first six months did improve on the same months of 2025. Here are the first halves of 2025 and 2026, with the first half of 2019 for reference:
| Group and measure | Jan-Jun 2019 | Jan-Jun 2025 | Jan-Jun 2026 | Change, 2025 to 2026 | Change, 2019 to 2026 |
|---|---|---|---|---|---|
| White: rate per 100k | 73.8 | 98.1 | 94.6 | -3.5% | +28.2% |
| White: times White rate | 1.00 | 1.00 | 1.00 | ||
| Black: rate per 100k | 322.6 | 455.9 | 443.0 | -2.8% | +37.3% |
| Black: times White rate | 4.37 | 4.65 | 4.68 | ||
| Hispanic: rate per 100k | 213.9 | 317.4 | 309.2 | -2.6% | +44.6% |
| Hispanic: times White rate | 2.90 | 3.24 | 3.27 | ||
| Asian/Pacific Islander: rate per 100k | 120.9 | 168.9 | 169.3 | +0.2% | +40.0% |
| Asian/Pacific Islander: times White rate | 1.64 | 1.72 | 1.79 | ||
| Black: times White rate, excluding police assaults | 4.56 | 5.24 | 5.25 |
Robbery records fell for every group. Black robbery records dropped 14.6 percent. Murder records fell for Black and Hispanic New Yorkers. Those gains belong in the record. But the gap did not close. The Black multiple edged up from 4.65 to 4.68.
But felony assault did not budge. Black records rose 1.5 percent and Asian/Pacific Islander records 4.5 percent. In the first half of 2025, complaint records across the four groups were 38.7 percent above the same months of 2019. In the first half of 2026, they were 35.3 percent above. That is a small step down a steep climb.
The same rule applies to the mayor as to everyone else here. A decline during his tenure does not, by itself, prove his policies produced it.
Treat the 2026 comparison as provisional. The data snapshots allow different amounts of time for revision: the 2025 records were last updated about ten months after that period ended, the 2026 records about four weeks after.
Counting only complaints reported by June 30 in both years keeps late reports out of both, but it does not remove that difference, because corrections and reclassifications continue after a report is filed.
Revisions do move published numbers: NYPD’s count of reported murders, rapes, robberies and felony assaults for January through September 2025 rose 1.3 percent between its September 2025 and September 2026 releases, from 35,545 to 35,994.
Source: NYC Open Data complaint records, January 1 to June 30 of each year, same filters and population base.
The Coding Change Hidden in the Data
Forensic work means attacking your own numbers before anyone else does. When I did, I found a change in how NYPD’s records describe assaulted police officers.
In the first half of 2019, NYPD logged 720 complaint records for assaults on police and peace officers. In 460 of them, the victim’s race was recorded as unknown, so those records vanish from any count by race. In the first half of 2026, there were 1,164 such records. Only 268 had unknown race.
The shift tracks a victim code, “L,” that first appeared in volume in 2022 and later covered most officer-assault records. NYPD’s published footnotes, as reviewed for this article, do not define it. Officers also appear under other victim codes, before and after 2022, so deleting the code would not remove them consistently.
That is a large change in who gets counted. The records cannot say how much reflects better recording and how much reflects more assaults on officers. So I removed every record carrying the offense description “ASSAULT POLICE/PEACE OFFICER,” in every period, and ran the numbers again.
| Group | 2019 to 2025, all records | Excluding police assaults | Jan-Jun 2019 to 2026, all records | Excluding police assaults |
|---|---|---|---|---|
| White | +35.4% | +24.7% | +28.2% | +18.2% |
| Black | +36.1% | +34.8% | +37.3% | +35.9% |
| Hispanic | +39.4% | +35.6% | +44.6% | +40.8% |
| Asian/Pacific Islander | +28.1% | +22.3% | +40.0% | +32.8% |
The finding survives. The increase shrinks most for White New Yorkers, but every group is still higher. And the Black-White gap gets wider, not narrower: excluding officer assaults, it rose from 4.56 in the first half of 2019 to 5.25 in the first half of 2026. Remove rape as well, because New York broadened its legal definition in 2024, and it still rose, from 4.67 to 5.31.
Officers are victims too. That is why the headline figures include them.
Source: NYC Open Data complaint records, offense code 106, offense description ASSAULT POLICE/PEACE OFFICER.
Citywide totals tell you how much violent crime New York recorded. They don’t tell you who carried it. These records do.
S.E. Antar
Note on the numbers: Each complaint record carries demographic fields for a victim, including the race and ethnicity NYPD recorded. Records are not unique people. One person can appear more than once, and nonresidents are included. They describe victims, not offenders, and crime never reported to police is not in them.
The complaint-record counts come from NYPD’s public complaint data, and rates divide those counts by Census population estimates. The citywide reported-crime figures come from NYPD’s published crime releases. The full workings for the victim records are in the data appendix.
Methodology: NYPD complaint records on NYC Open Data, extracted October 11, 2026, for offense codes 101 (murder and non-negligent manslaughter), 104 (rape), 105 (robbery) and 106 (felony assault). A record counts only if both its occurrence date and its report date fall inside the period, so every period gets the same reporting window.
Business and People of the State victim codes (D and E) are excluded. White and Black mean non-Hispanic; Hispanic combines NYPD’s White Hispanic and Black Hispanic. Records with unknown race (about 5 to 6 percent in each period checked) and American Indian/Alaska Native records are not included in the four groups and are not reassigned; the unknown-race test above and the data appendix show their effect.
Rates use the Census population figures printed in each year’s NYPD annual report, and the 2024 American Community Survey for 2025 and 2026. The main series draws on survey estimates from different reference years, and Census methods changed over the period; the 2024 survey populations used for 2025 and 2026 were selected by the author, not taken from NYPD reports. The 2020 and 2021 reports, and therefore those years’ rates, use 2018 ACS populations.
New York broadened its legal definition of rape in September 2024; excluding rape entirely, every group still rose.
The data appendix lists the counts, population figures and queries for every period compared; the 2020 to 2023 values in the chart were independently re-queried from Open Data by a second analyst and match exactly.
Sources
- Sam E. Antar, Data Appendix: NYC Violent Victimization by Race, 2018 to June 2026 (PDF)
- NYPD, September 2019 crime statistics, October 2019 (reported crimes)
- NYPD, record-low shootings for first nine months of 2025, October 1, 2025 (reported crimes)
- NYPD, September 2026 crime statistics, October 6, 2026 (reported crimes)
- Comparisons of the September releases are the author’s calculations
- NYPD, first-half 2026 crime release, July 2, 2026
- NYC Open Data: NYPD Complaint Data Historic and Current Year to Date
- NYPD Crime and Enforcement Activity reports: 2018, 2019, 2024
- U.S. Census Bureau, 2024 American Community Survey, via Census Reporter
- Office of the Governor, Kathy Hochul sworn in as 57th Governor, August 24, 2021
- Spectrum News, Hochul urges judges, DAs to take bail changes into account, August 3, 2022
- Queens Daily Eagle, Hochul signs bail changes into law, May 5, 2023
- Spectrum News, Criminal justice advocates criticize AG James over bail law, January 24, 2020
- NY1, Hochul defends bail reform as Zeldin challenges her on crime, August 8, 2022
- WNYC, The incoming mayor and his police commissioner disagree over bail reform, November 26, 2025
- NYC Department of City Planning, Understanding Current Population Trends in NYC
- U.S. Census Bureau, County Population by Characteristics: 2020-2025 (Vintage 2025); New York county data (CSV); field definitions (PDF)
- Spectrum News, New York expands the legal definition of rape, January 30, 2024
- U.S. Census Bureau, Census Bureau Releases Estimates of Undercount and Overcount in the 2020 Census, March 10, 2022
Disclosure: This analysis rests entirely on public records and is a good-faith review of data on a matter of public concern. Nothing in it is a finding that any official caused the changes described.
Written by Sam E. Antar | Forensic Accountant & Fraud Investigator
Follow @SamAntar on X.
© 2026 Sam E. Antar. All rights reserved.