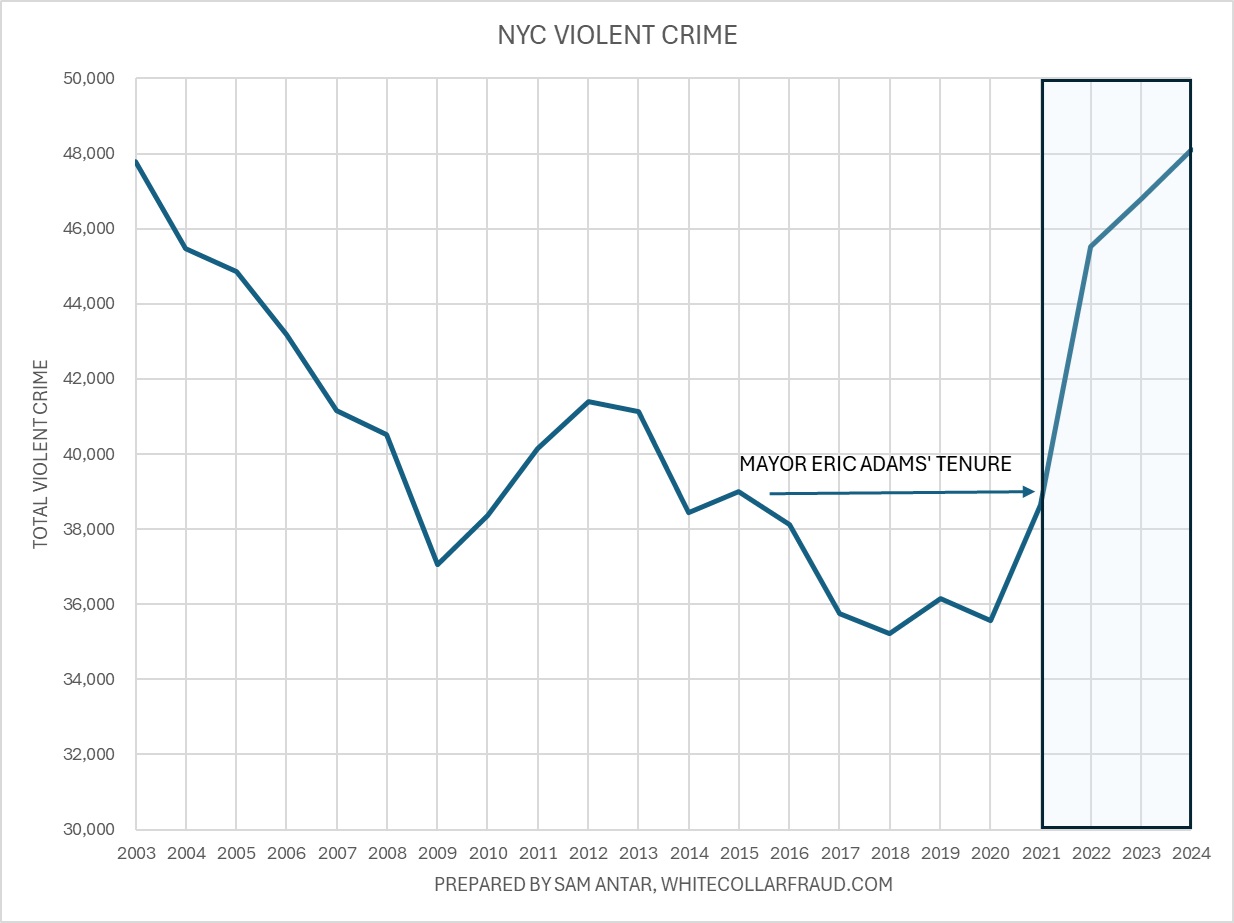
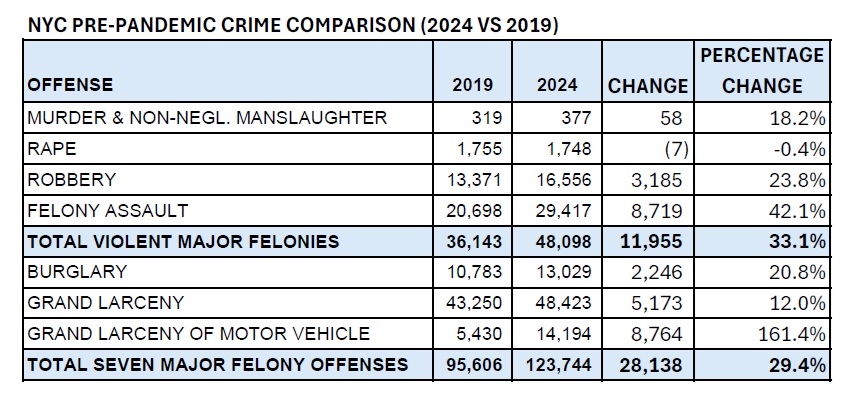
New York City faces its worst violent crime rate in over two decades, with 48,098 violent crimes reported in 2024 – levels not seen since 2002. Yet on January 6, 2025, NYPD Commissioner Jessica S. Tisch presented a different story, touting “a nearly 3% reduction in overall index crime” and claiming 3,662 fewer incidents meant “thousands of fewer victims of violence and disorder across the five boroughs.”
The stark reality behind these carefully massaged numbers tells a different story:
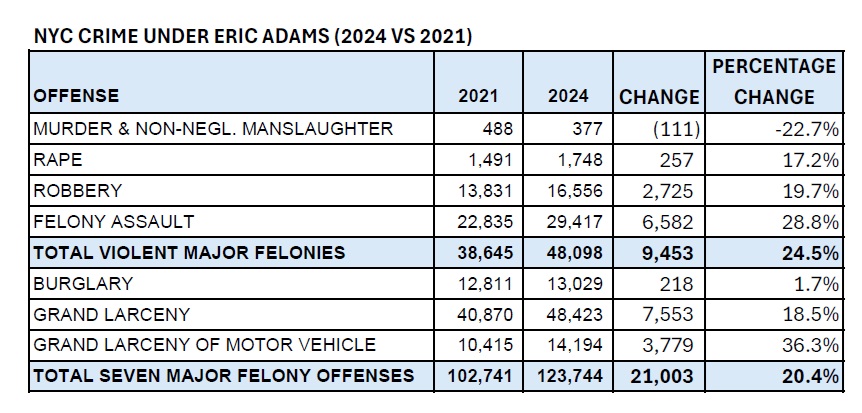
- Violent crime has surged 24.5% under Mayor Adams’ tenure, with 9,453 additional incidents since 2021
- Total index crime has exploded by 21,003 incidents (20.4%) since Adams took office
- Compared to pre-pandemic 2019, violent crime has jumped by 33.1%, affecting 11,955 more victims
- The city now faces its highest violent crime levels since 2002, a fact entirely absent from the NYPD’s press release
- While celebrating a 5.0% decrease in grand larceny, the NYPD obscures that petit larceny barely changed (-0.03%) – suggesting a possible systematic downgrading of crimes rather than an actual reduction
Our investigation reveals how carefully crafted press releases and meticulously massaged numbers obscure this troubling surge in violent crime. Most tellingly, while Tisch prominently celebrates a 7.3% reduction in shootings, she buries the fact that these same incidents are included in the violent crime statistics that show a disturbing 2.8% increase. This sleight of hand allows the NYPD to trumpet success while hiding failure in the broader category where these crimes are actually counted.
The NYPD tracks seven major “index crimes” in two categories:
- Violent Crimes: murder, rape, robbery, and felony assault
- Property Crimes: burglary, grand larceny, and auto theft
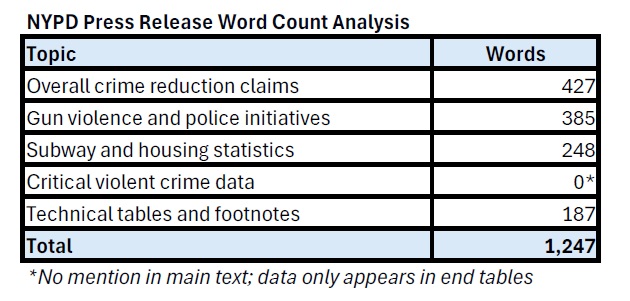
While reported property crimes have decreased, violent crime tells a drastically different story. In a press release spanning 1,247 words, not a single sentence in the main text addresses the alarming surge in felony assaults or total violent crime. These critical statistics are deliberately buried in dense statistical tables at the end of the document, seemingly designed to go unnoticed by reporters working on deadline.
“Through precision policing, lives are being saved every day in New York,” Tisch declared. Additionally, she praised her officers for “leveraging state-of-the-art technology, effectively building and closing high-quality cases, and strengthening crucial relationships that contribute to our success.”
The Surgery Defense: How Medical Advancement Masks Rising Violence
Perhaps the most cynical sleight of hand in the NYPD’s statistical arsenal involves murder rates. Yes, murders decreased by 14 cases in 2024. Naturally, it’s a number Tisch’s office prominently features in their reports.
Yet they conveniently omit a crucial fact: during the same period, felony assaults—a category that includes attempted murders—skyrocketed by 1,414 cases. As a result, these incidents reached a staggering 29,417 total.
Consider that number: 1,414 additional violent felonies. This isn’t a statistical blip. Rather, it’s a surge that would have made headlines in any era before this administration’s masterclass in data manipulation.
The truth is straightforward: often, the only difference between an attempted murder and a successful one is the skill of trauma surgeons and the luck of response time. Meanwhile, the violent intent remains the same—it’s just being hidden behind medical advancement.
The Invisible Bullets: A Dangerous Game of Definition and Double-Counting
If the manipulation of murder statistics seems troubling, the NYPD’s approach to counting shootings is even more alarming. Under current leadership, a “shooting incident” only counts when bullets strike flesh. Consequently, this creates several dangerous blind spots in the data.
Consider these scenarios:
- A spray of bullets into a crowded street isn’t a “shooting” if everyone ducks in time
- A drive-by targeting a family home doesn’t count if the shooter’s aim is off
- Bullets through a classroom window are statistically invisible if they miss the students
Yet there’s another layer to this deception, one that reveals the calculated nature of the NYPD’s statistical presentation. Commissioner Tisch prominently features shooting statistics as a separate category in her press releases and public statements, celebrating a 7.3% reduction. However, she deliberately downplays a crucial fact: every single one of these shootings is already counted within the violent felony statistics – the same category showing a troubling 2.8% increase. By separating out shootings for positive press while burying their inclusion in the rising violent crime numbers, the NYPD creates an illusion of success while hiding the broader failure.
Consider a month with 100 felony assaults, including 20 shooting incidents where someone was hit by gunfire. These 20 shootings appear twice in NYPD’s reporting: first as part of the 100 felony assaults in index crimes, then again separately as “shooting incidents
The Technical Details: A Pattern of Statistical Revision
On January 4, 2024, then-Commissioner Edward Caban initially reported encouraging numbers, claiming a 0.3% reduction of 409 incidents (126,678 vs. 127,087). But subsequent revisions tell a different story.
By January 15, 2024, the NYPD quietly adjusted the numbers:
- First, 2023 numbers increased from 126,678 to 126,786
- Then, 2022 numbers decreased from 127,087 to 126,589
This seemingly minor revision transformed a reported decrease into a 0.03% increase. Notably, this change was never publicly acknowledged.
The manipulation continued under Commissioner Tisch. Her January 6, 2025 press release showed index crimes for 2023 suddenly climbing to 127,406 — a startling increase of 728 incidents from the number initially reported on January 4, 2024. This marks the third different official count for 2023’s index crimes:
- Initial report (January 4, 2024): 126,678
- Revised count (January 29, 2024): 126,786
- Latest release (January 6, 2025): 127,406
This upward revision, representing a 0.57% increase in total index crimes, came without explanation or acknowledgment of the previous figures.
The pattern is clear: each “quiet” revision serves a dual purpose. First, it obscures real-time performance by constantly shifting the baseline. Second, and perhaps more troublingly, each upward revision of past years’ crime statistics creates a more favorable basis for future comparisons.
By retroactively inflating 2023’s numbers to 127,406 incidents, the NYPD has engineered a higher baseline against which 2024’s performance can be measured – making the reported 2.9% reduction appear more significant than it would have been against the original baseline.
A Tale of Two Years: The Real 2024 vs 2023 Story
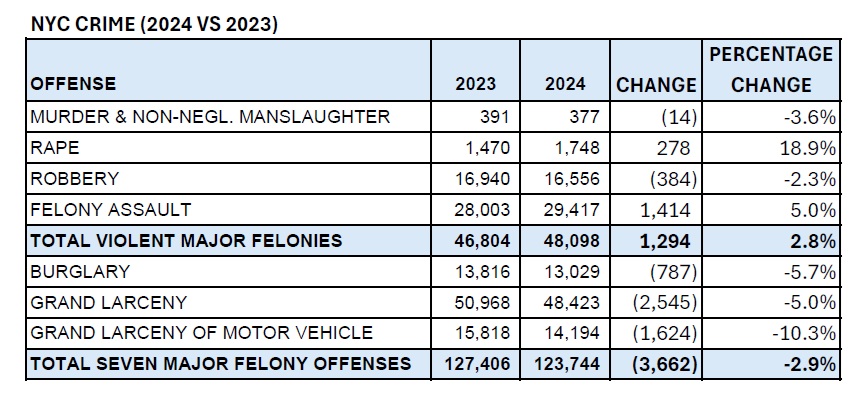
A deeper analysis of the 2024 vs 2023 comparison reveals a more complex and troubling picture than the headline 2.9% reduction in total index crime suggests:
Violent Crime Surge:
- Total violent crime actually increased by 1,294 incidents (from 46,804 to 48,098), representing a 2.8% rise
- Rape cases surged by 278 incidents (+18.9%)
- Felony assaults increased by 1,414 incidents (+5.0%)
- These increases were partially offset by decreases in murder (-14 cases, -3.6%) and robbery (-384 cases, -2.3%)
Property Crime Improvements:
- Grand larceny decreased by 2,545 cases (-5.0%)
- Auto theft dropped by 1,624 incidents (-10.3%)
- Burglary declined by 787 cases (-5.7%)
The Classification Game: A Tale of Two Larcenies
The NYPD’s manipulation of statistics extends beyond creative counting – it appears to include creative classification as well. A striking pattern emerges when examining larceny statistics that the department hoped would go unnoticed.
While grand larceny decreased by 5.0%, petit larceny declined by only 0.03% during the same period. The only distinction between these categories is the dollar value of items stolen – nothing else. This dramatic disparity defies logical explanation: why would thieves suddenly become far less likely to steal items valued above the grand larceny threshold while continuing to steal lower-value items at nearly the same rate?
If grand larceny had declined at the same modest rate as petit larceny, there would have been 2,530 additional index crimes. This alone would have reduced the NYPD’s celebrated 2.9% decrease in total index crime to just 0.9%. The stark difference between these trends raises serious questions about classification decisions happening behind the scenes.
This pattern suggests a possible systematic downgrading of grand larcenies to petit larcenies – a simple way to improve index crime statistics since only grand larcenies count in the index total. The nearly identical nature of these crimes makes such manipulation particularly difficult to detect without this type of comparative analysis.
The Shell Game: Small Victories Hiding Major Failures
A clear pattern emerges in the NYPD’s statistical presentation: small reductions in specific categories are prominently featured while larger increases in broader categories are buried. This sleight of hand appears repeatedly:
- Shootings are down by 71 incidents (-7.3%) – prominently featured
Yet violent crime, where these same shootings are counted, is up by 1,294 incidents (+2.8%) - Murders decreased by 14 cases (-3.6%) – highlighted in press materials
Meanwhile, felony assaults, which include attempted murders, surged by 1,414 cases (+5.0%) - Property crime improvements are emphasized
While the much more serious category of violent crime shows disturbing increases - Grand larceny’s 5.0% decrease is celebrated
But this may simply reflect reclassification, as petit larceny barely changed (-0.03%)
In each case, the NYPD trumpets a small statistical victory while burying a larger, more significant failure. This isn’t random – it’s a systematic approach to data presentation that minimizes public awareness of rising violent crime.
The Numbers They Hope You Won’t Notice: A Tale of Two Comparisons
The Adams Effect: 2024 vs 2021
The transformation of New York under Adams’ leadership becomes stark when we examine the numbers. Total index crime exploded by 21,003 incidents—a shocking 20.4% increase. Meanwhile, violent crime surged by 9,453 incidents, representing a 24.5% spike.
The breakdown is equally troubling:
• Felony assaults soared by 6,582 cases (28.8%)
• Robbery increased by 2,725 incidents (19.7%)
• Rape cases rose by 257 incidents (17.2%)
• Grand larceny jumped by 7,553 cases (18.5%)
• Auto theft increased by 3,779 incidents (36.3%)
Behind each of these numbers are real victims—mothers, fathers, children, and elderly residents. Yet their stories remain buried beneath tables of statistics. Under Adams’ watch, nearly 10,000 additional New Yorkers became victims of violent crime compared to the year before he took office.
Beyond the Pandemic Excuse: 2024 vs 2019
City Hall’s standard defense is predictable: blame COVID-19 for the crime surge. But this excuse collapses when we compare 2024 to 2019—the last full year before the pandemic. Not only has crime failed to return to pre-pandemic levels, it has exploded far beyond them, making the COVID-19 explanation impossible to defend.
The increases are staggering:
- Murder rose by 18.2%, representing 58 additional lives lost
- Robbery surged by 23.8%, with 3,185 more New Yorkers victimized
- Felony assaults increased by 42.1%, affecting 8,719 more residents
- Total violent crime jumped by 33.1%, impacting 11,955 additional victims
- Overall index crime climbed by 29.4%, with 28,138 more reported incidents
- Auto theft surged by 161.4%
- Grand larceny rose by 12.0%
In total, comparing 2024 to pre-pandemic 2019 reveals a city where violent crime has risen by nearly 12,000 incidents. This isn’t a statistical anomaly. Rather, it represents a fundamental breakdown in public safety.
Conclusion
Commissioner Tisch’s attempt to claim credit for an entire year’s “success” after barely a month on the job fits a troubling pattern. The NYPD’s approach transforms what should be a comprehensive public safety assessment into a statistical shell game.
The truth lies in the numbers they don’t want you to see: violent crime has surged past 2002 levels. Moreover, it increased by nearly 1,300 victims in the past year alone. Furthermore, it has risen by over 9,400 victims in recent years.
No amount of statistical sorcery can hide the reality of New York’s current public safety challenges. The carefully constructed narrative of crime reduction crumbles under the weight of comprehensive, unmanipulated data. New Yorkers deserve transparency, not statistical sleight of hand.
Written by Sam Antar
© 2025 Sam Antar. All rights reserved.
