The NYPD publishes two official reports every week. One says crime is down. The other says New Yorkers are calling for help more than ever. The department has never explained why. Nobody appears to have asked.
Don’t take our word for it. Take theirs.
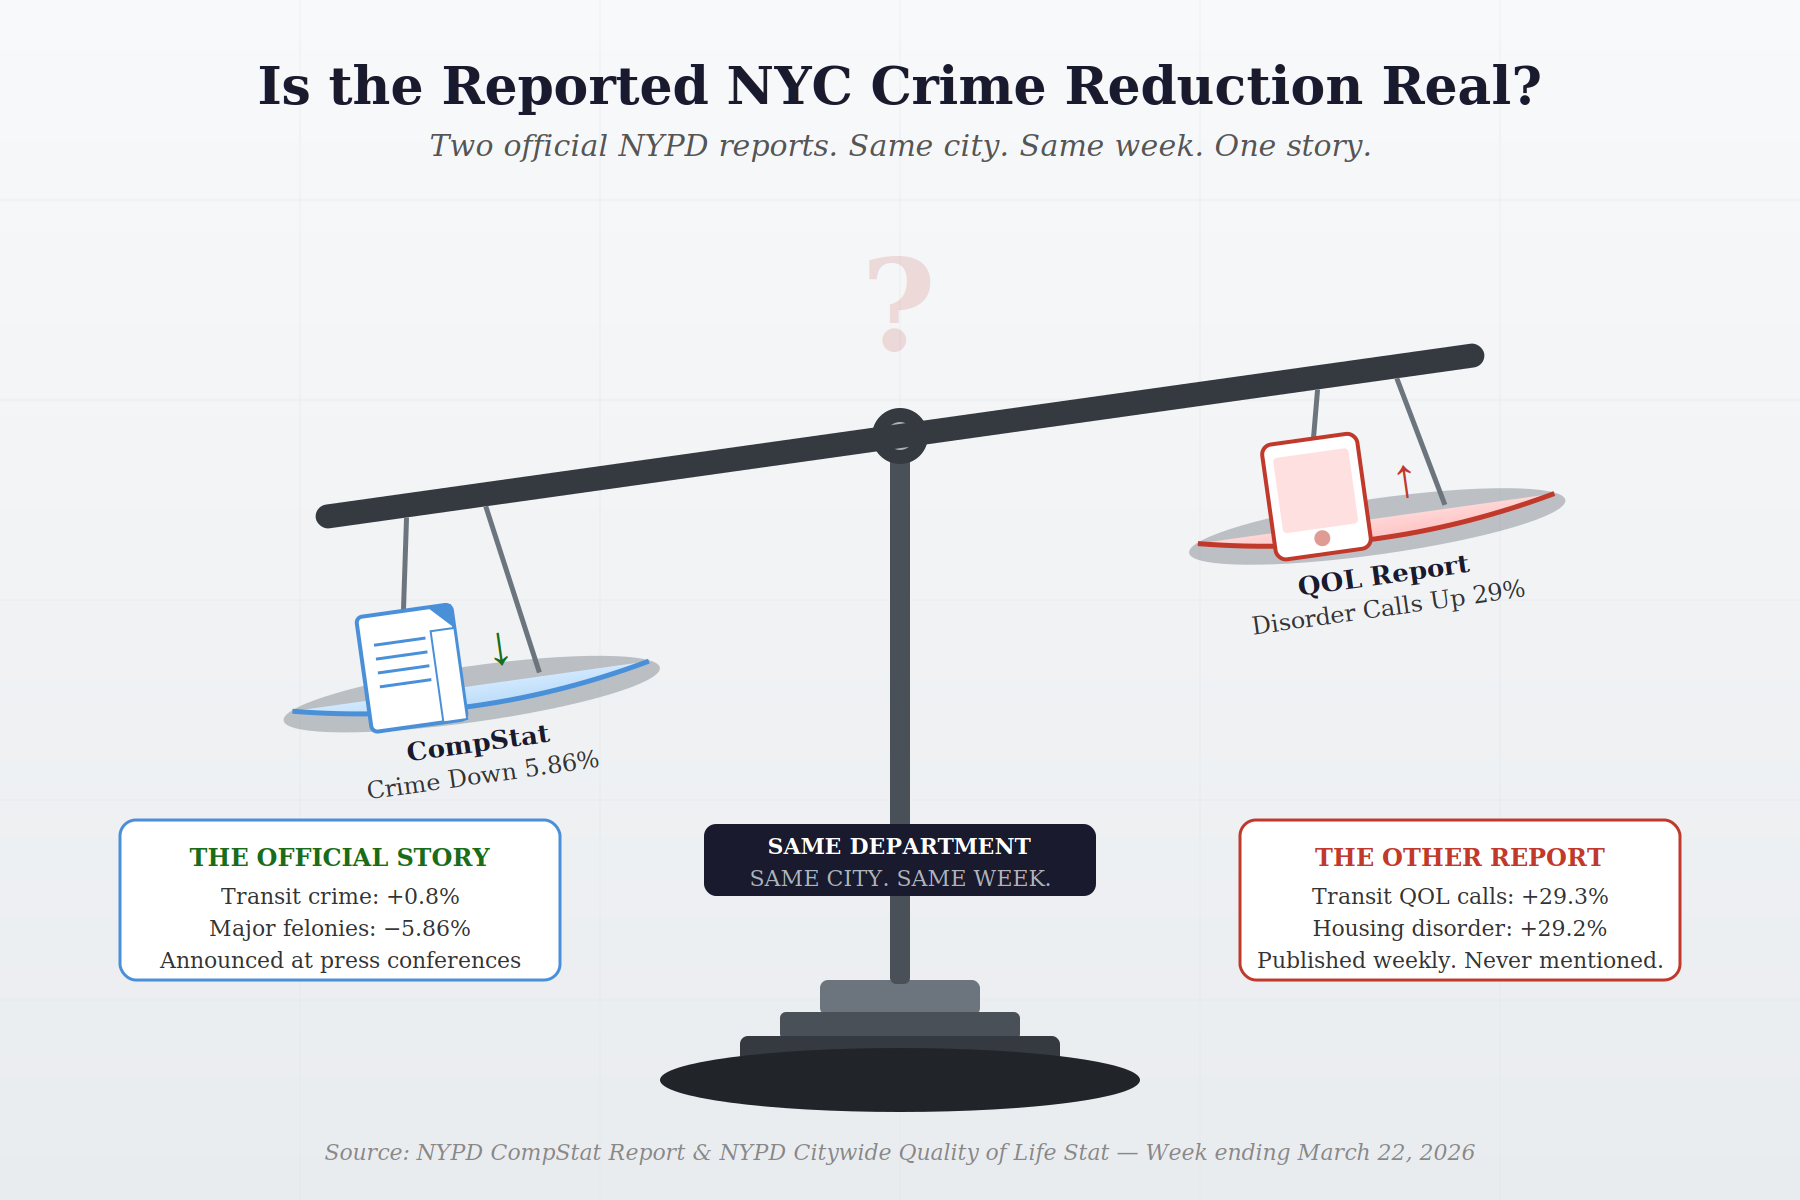
The NYPD’s own CompStat report says crime is down nearly 6% this year. The NYPD’s own Quality of Life report says transit disorder complaints are up 29%, housing disorder complaints are up 29%, and disorderly persons calls are up 20%. The NYPD’s own researchers have documented that every single initial crime figure published over the past eight years was later revised upward — every one — with the revision rate now running at nearly 5% and climbing.
The question it raises is simple: if the numbers are this hard to reconcile, what exactly is being measured?
The Numbers They’d Rather You Didn’t Compare
The CompStat report for the period through March 22, 2026 shows major crime down 5.86% year-to-date. The department has said so loudly and repeatedly. What it has said nothing about is the second report it publishes covering the identical period — the Citywide Quality of Life Stat, prepared by its own Quality of Life Division.
Here is what that report shows.
| Category | 2025 YTD | 2026 YTD | Change |
|---|---|---|---|
| Transit Crime (CompStat) | 482 | 486 | +0.8% |
| Transit QOL Complaints | 14,936 | 19,313 | +29.3% |
| Housing QOL Complaints | 15,603 | 20,157 | +29.2% |
| Disorderly Persons Calls | 22,688 | 27,307 | +20.4% |
| Total 911 QOL Calls | 38,039 | 42,222 | +11.0% |
| Drug Use/Sale/OD Calls | 8,662 | 5,579 | −35.6% |
| Undomiciled Complaints | 4,881 | 4,522 | −7.4% |
The department is simultaneously telling you that transit crime is essentially flat — up 0.8%, barely worth mentioning — while its own Quality of Life Division is recording 4,377 additional disorder complaints about the same subway system over the same period. That is a 29.3% increase in residents deciding something is wrong enough to call. Against a 0.8% change in classified crime.
Those two numbers describe the same trains. They cannot both be telling the full story. And there is one more dimension to the transit picture that makes it worse: independent analysis of NYPD revision patterns shows that transit crime figures are currently revising upward at 11.2% — nearly triple the citywide average of 4.6%. The 0.8% transit crime increase is not only contradicted by disorder calls. It is the least settled number in the entire report, and the one most likely to flip from flat to up once the auditing process runs its course.
The same pattern holds in public housing — 29.2% more disorder complaints against a backdrop of announced historic lows in housing crime. In the environments where the department has most aggressively claimed victory, its own call data is telling a different story. That story doesn’t appear at press conferences. It lives in the second report.
The disorder picture is not uniform and honesty requires saying so. Drug calls are down 35.6%. Undomiciled complaints are down 7.4%. Those are real declines. But whether they reflect fewer drugs on the street or a shift in how residents and dispatchers categorize these calls is itself a question the data cannot answer — and by the logic of Problem One, any large movement in call volume in either direction invites the same scrutiny as a movement in classified crime. The total disorderly behavior index — which aggregates everything — shows only a 1.2% increase, because the drug decline is large enough to bury the rises in a composite average. An index that masks a 35% drop and a 20% rise behind a 1.2% headline is not measurement. It is arithmetic used as camouflage.
Problem One: The Reports Don’t Reconcile
CompStat measures crimes that get classified. Calls for service measure what residents experience and decide to report. The gap between those two things is not a technical footnote. It is where the real question lives. Independent analysis of 2025 NYPD 911 call data by the Vera Institute found that only 42% of calls routed to police were categorized by dispatchers as crime related — meaning the overwhelming majority of what drives 911 volume has nothing to do with what CompStat measures.
When a crime goes unreported — because the victim doesn’t trust the system, because an officer doesn’t write it up, because the incident doesn’t fit neatly into a legal category — it vanishes from CompStat. But the person who experienced it may still call 911. They may describe a condition rather than a crime. That call shows up in the Quality of Life report, uncategorized and uncounted in the headline number, invisible to anyone reading only CompStat.
One important clarification before proceeding: the Quality of Life report does not capture all 911 calls or all crime-related complaints. It reflects a curated subset of incidents categorized as disorder, nuisance, or public condition — explicitly excluding serious crime calls like robberies, assaults, and shootings, which route directly into CompStat. That distinction does not weaken the comparison. It sharpens it. What the QOL report measures is precisely the category of incidents most likely to be under-classified, downgraded, or never converted into formal crimes — the lived conditions that residents experience and report before the system decides whether to count them. In the environments where that signal is strongest — transit, housing, street-level disorder — it is moving sharply in the opposite direction from classified crime.
The department publishes both reports. It has never explained why they point in different directions. It has never been asked to.
Problem Two: The Department Changed the Rules Mid-Game
Here is something that did not make the headline when the NYPD released its February 2026 statistics: the department quietly changed how it counts hate crimes.
Previously, the NYPD included alleged hate crimes still under review in its monthly totals. Starting this year, it reports only incidents that have been investigated and officially confirmed by the Hate Crimes Task Force. That is a meaningful methodological change — fewer incidents qualify under the new standard than under the old one.
The department announced this in a single sentence near the bottom of its February press release. A footnote on the hate crime table reads: “Statistics above reflect the updated methodology for reporting on hate crimes.”
That footnote is doing an enormous amount of work.
The CompStat report shows hate crimes up 25.5% year-to-date — 128 incidents in 2026 versus 102 in 2025. That comparison is presented as a year-over-year trend. But the 2025 number was counted one way and the 2026 number was counted another way. You cannot subtract them and call the result a trend. You can call it a number. It is not the same thing.
To be precise: the new methodology may be more accurate. Counting only confirmed hate crimes rather than alleged ones has a logic to it. But if the 2026 figure excludes unconfirmed incidents and the 2025 baseline included them, the real increase in confirmed hate crimes could be substantially higher than 25.5%. The methodological change may be suppressing the number. The department has made it impossible to know.
What is certain is this: the NYPD is reporting a year-over-year percentage change for a category it redefined between the two years being compared. That comparison is not meaningful. It was presented without caveat in the same report announcing historic crime lows.
This is the classification problem in its sharpest form. A system where the definition of what counts can change between the baseline year and the current year — announced quietly, buried in a footnote — producing a percentage that looks like measurement but functions like narrative.
If they can do it with hate crimes, the mechanism is available everywhere. Only the footnote changes.
Problem Three: The Numbers Don’t Hold Still — and Neither Does the Baseline
Now for the part the department definitely does not want you to think about.
Vital City recently published an analysis of eight years of NYPD press releases, tracking how initial monthly crime totals change as they move through the department’s auditing process. The finding is stark: of 95 monthly major crime totals examined, spanning 2018 through late 2025, every single one was later revised upward. Not most. Not the majority. Every one. The revisions move in one direction only.
The average upward revision across the full period is 2.7%. Under Commissioner Tisch, that average has jumped to 4.7% — and it is still climbing as recent months continue to mature. The January 2025 murder count illustrates exactly what this means: initially announced as 25, a 24.1% decline from the prior year, later revised to 30. The actual decline was 9%. The headline overstated it by nearly three times. By the time the correction arrived, the original number had already shaped the coverage, the press conferences, and the public perception. The correction made no headlines at all.
The reported year-to-date crime decline is 5.86%. The current revision rate is 4.7% and climbing. The distance between those two numbers is 1.16 percentage points. That is the margin the department is asking you to treat as a confirmed historic achievement.
Now here is the observation this analysis puts forward independently, building on but distinct from Vital City’s findings.
Those upward revisions don’t just affect the current year’s numbers. They affect the baseline.
| Period | Initially Reported | Later Revised To | Revision |
|---|---|---|---|
| February 2025 Index Crimes | 7,821 | 8,250 | +5.5% |
| January 2025 Murders | 25 (−24.1% YOY) | 30 (−9.0% YOY) | +20.0% |
| Average revision 2018–2025 | — | — | +2.7% |
| Average revision under Tisch | — | — | +4.7% (and climbing) |
When the NYPD compares 2026 to February 2025, it compares against 8,250, not 7,821. The higher revised baseline makes the current year’s decline look larger than it would against the originally reported figure.
At the same time, the current year’s figures are sitting at their unrevised low point — preliminary numbers that have not yet gone through the same auditing process that pushed every prior month higher.
The reported decline is therefore potentially inflated at both ends simultaneously. The prior year’s baseline has already been revised upward. The current year’s numbers haven’t been revised yet. The 5.86% decline sits between those two moving points — and both of them move in the same direction.
This is not a measurement system that happens to produce favorable headlines. It is a measurement framework that consistently produces more favorable initial numbers and less visible upward corrections later — with the corrections arriving quietly, after the news cycle has ended, in a revised figure buried in next month’s comparison column.
Three separate problems. One direction. The same result.
Problem Four: “Historic Lows” Measured From the Wrong Starting Line
There is one more number the department does not want placed next to its press releases: 95,606.
That is the total number of major felony offenses in New York City in 2019 — the last full pre-pandemic year, representing the actual trend line the city was on before COVID disrupted everything. The NYPD’s own published historical data shows it plainly.
The department’s 2025 full-year total was 121,652 major felonies. That is 27.2% higher than 2019. Not lower. Higher.
| Offense | 2019 | 2025 | Change vs 2019 |
|---|---|---|---|
| Murder | 319 | 309 | −3.1% |
| Rape | 1,755 | 2,048 | +16.7% |
| Robbery | 13,371 | 15,075 | +12.7% |
| Felony Assault | 20,698 | 29,838 | +44.2% |
| Violent Crime Subtotal | 36,143 | 47,270 | +30.8% |
| Burglary | 10,783 | 12,798 | +18.7% |
| Grand Larceny | 43,250 | 48,061 | +11.1% |
| Grand Larceny Auto | 5,430 | 13,523 | +149.0% |
| Total Major Felonies | 95,606 | 121,652 | +27.2% |
Only murder is below its 2019 level. Every other category is higher. And the violent crime picture deserves its own examination.
Violent crime — murder, rape, robbery, and felony assault combined — totaled 47,270 incidents in 2025. In 2019 that number was 36,143. That is an increase of 11,127 violent crimes against people, or 30.8%, above the pre-pandemic baseline. The department has not addressed this comparison at a press conference. It does not appear in CompStat framing. It is available to anyone who opens the historical table the department publishes and does the subtraction.
Felony assault drives most of that gap and demands its own paragraph. At 29,838 incidents in 2025, it is 44.2% above 2019 — 9,140 additional violent attacks on New Yorkers compared to where the city was six years ago. Felony assault is now the single largest violent crime category by volume and the largest driver of the gap between the “historic lows” narrative and pre-pandemic reality. It has been rising every year since 2019 without interruption. The department has offered no sustained public explanation.
There is a further dimension to the felony assault number that connects directly to the revision problem. Independent analysis of NYPD revision patterns identifies felony assault as the single largest contributor to upward revisions in 56 of the 95 months studied — because the line between a misdemeanor and a felony assault often turns on medical evidence that arrives after the initial report. A broken jaw, a loss of consciousness, a hospitalization upgrades the charge. That means the 44.2% increase against 2019 is itself a preliminary figure. The 2025 felony assault number has not yet finished revising. The actual gap above pre-pandemic may be larger than what the published data currently shows.
There is also a data point worth noting on rape. The department has attributed part of the increase to a 2024 legislative change broadening the legal definition of rape in New York State. That is a partial explanation — but partial only. Independent analysis estimated the expanded definition accounted for roughly one fifth of reported rapes through mid-2025. The remaining increase is not explained by the definitional change.
There is something additionally worth noting in the full historical series. Violent crime in 2025, at 47,270, is higher than every single year between 2009 and 2021. The number being celebrated as a historic low would have been reported as a serious public safety problem in any year of the previous decade. The baseline being used to manufacture the milestone is the pandemic spike. Remove that spike and the achievement disappears.
The Full Picture: 2000–2025
The following table presents the complete NYPD historical record with violent crime subtotals added. It is drawn directly from the department’s own published data. It has not been presented this way at a press conference.
| Year | Murder | Rape | Robbery | Fel. Assault | Violent Subtotal | Burglary | Gr. Larceny | GLA Auto | Total |
|---|---|---|---|---|---|---|---|---|---|
| 2000 | 673 | 2,068 | 32,562 | 25,924 | 61,227 | 38,352 | 49,631 | 35,442 | 184,652 |
| 2001 | 649 | 1,981 | 28,202 | 23,453 | 54,285 | 32,763 | 46,329 | 29,531 | 162,908 |
| 2002 | 587 | 2,144 | 27,229 | 21,147 | 51,107 | 31,275 | 45,771 | 26,656 | 154,809 |
| 2003 | 597 | 2,070 | 25,989 | 19,139 | 47,795 | 29,110 | 46,751 | 23,413 | 147,069 |
| 2004 | 570 | 1,905 | 24,373 | 18,622 | 45,470 | 26,976 | 48,763 | 20,884 | 142,093 |
| 2005 | 539 | 1,858 | 24,722 | 17,750 | 44,869 | 24,117 | 48,243 | 18,246 | 135,475 |
| 2006 | 596 | 1,525 | 23,739 | 17,309 | 43,169 | 23,143 | 46,625 | 15,745 | 128,682 |
| 2007 | 496 | 1,351 | 21,809 | 17,493 | 41,149 | 21,762 | 44,924 | 13,174 | 121,009 |
| 2008 | 523 | 1,299 | 22,401 | 16,284 | 40,507 | 20,725 | 44,242 | 12,482 | 117,956 |
| 2009 | 471 | 1,205 | 18,601 | 16,773 | 37,050 | 19,430 | 39,580 | 10,670 | 106,730 |
| 2010 | 536 | 1,373 | 19,486 | 16,956 | 38,351 | 18,600 | 37,835 | 10,329 | 105,115 |
| 2011 | 515 | 1,420 | 19,717 | 18,482 | 40,134 | 18,720 | 38,501 | 9,314 | 106,669 |
| 2012 | 419 | 1,445 | 20,144 | 19,381 | 41,389 | 19,168 | 42,497 | 8,093 | 111,147 |
| 2013 | 335 | 1,378 | 19,128 | 20,297 | 41,138 | 17,429 | 45,368 | 7,400 | 111,335 |
| 2014 | 333 | 1,352 | 16,539 | 20,207 | 38,431 | 16,765 | 43,862 | 7,664 | 106,722 |
| 2015 | 352 | 1,438 | 16,931 | 20,270 | 38,991 | 15,125 | 44,005 | 7,332 | 105,453 |
| 2016 | 335 | 1,438 | 15,500 | 20,847 | 38,120 | 12,990 | 44,279 | 6,327 | 101,716 |
| 2017 | 292 | 1,449 | 13,956 | 20,052 | 35,749 | 12,083 | 43,150 | 5,676 | 96,658 |
| 2018 | 295 | 1,794 | 12,913 | 20,208 | 35,210 | 11,687 | 43,558 | 5,428 | 95,883 |
| 2019 | 319 | 1,755 | 13,371 | 20,698 | 36,143 | 10,783 | 43,250 | 5,430 | 95,606 |
| 2020 | 468 | 1,427 | 13,106 | 20,572 | 35,573 | 15,478 | 35,505 | 9,037 | 95,593 |
| 2021 | 488 | 1,491 | 13,831 | 22,835 | 38,645 | 12,811 | 40,870 | 10,415 | 102,741 |
| 2022 | 438 | 1,617 | 17,411 | 26,063 | 45,529 | 15,746 | 51,565 | 13,749 | 126,589 |
| 2023 | 391 | 1,455 | 16,910 | 27,876 | 46,632 | 13,773 | 50,586 | 15,795 | 126,786 |
| 2024 | 382 | 1,748 | 16,580 | 29,461 | 48,171 | 13,070 | 48,450 | 14,199 | 123,890 |
| 2025 | 309 | 2,048 | 15,075 | 29,838 | 47,270 | 12,798 | 48,061 | 13,523 | 121,652 |
Note: 2019 row bolded as pre-pandemic baseline. Pandemic and post-pandemic years (2020–2025) shaded in red for reference. Violent crime subtotal = Murder + Rape + Robbery + Felony Assault. Source: NYPD Seven Major Felony Offenses historical table. Violent crime subtotals calculated by this author.
The “historic lows” being announced at press conferences are lows measured against the pandemic years of 2020 through 2022 — years when crime spiked across nearly every category as the city shut down, ridership collapsed, and reporting patterns shifted. Coming down from a pandemic-driven spike back toward a level still 27% above 2019 — and 30.8% above 2019 in violent crime specifically — is not a historic achievement. It is a partial recovery being marketed as a milestone.
The department’s own 26-year historical table makes this comparison available to anyone who pulls the document. It has not appeared in a press conference. It has not been addressed in a CompStat report. It sits in a published PDF, waiting.
Four separate problems. One direction. The same result.
What Four Problems Mean Together
The transit disorder paradox. The mid-stream methodology change. The revision acceleration and baseline compounding. The historic lows framing measured against a pandemic spike rather than the pre-pandemic trend. Taken individually, the department has an answer for each. Taken together, they describe something no individual answer accounts for.
The reported crime decline rests on classified complaints that diverge sharply from real-time disorder signals in the city’s most politically watched environments. It is produced by a classification system whose rules changed between the baseline year and the current year. It is announced as a preliminary figure that every prior month shows will be revised upward. It is measured against a prior-year baseline that was itself revised upward after the press conferences ended. And it is celebrated as historic while the city remains 27% above where it was before the pandemic began.
Every one of those conditions pushes the reported number in the same direction. None of them are random. None of them are visible in the headline.
Consider what would have to be true for the current picture to be accurate. Classification thresholds would need to be applied consistently despite documented pressures to undercount. Preliminary figures would need to be reliable despite eight years of evidence that they are not. The comparison baseline would need to be meaningful despite being measured against pandemic-inflated years. The Quality of Life report would need to be irrelevant despite covering the same environments where crime is being celebrated as historic. Every one of those conditions would need to hold simultaneously. And every single one of them, independently, happens to produce a more favorable headline.
That may be coincidence. The reader can decide.
Why This Matters Beyond the Numbers
New York City’s public safety policy — deployments, resources, political messaging, budget decisions — is built on CompStat. The number the commissioner announces at a press conference becomes the basis for what gets funded, what gets cut, and who gets credit. The preliminary caveat printed at the bottom of every press release in small type is not boilerplate. It is the most important sentence in the document. Nobody reads it.
A department that announces transit crime up 0.8% while its own Quality of Life Division records transit disorder complaints up 29.3% is not giving the public a complete picture. A department that changes how it counts hate crimes between baseline and comparison year without prominently flagging the incomparability is not giving the public a complete picture. A department that announces historic crime declines using preliminary numbers that its own eight-year track record shows will be revised significantly upward is not giving the public a complete picture.
It is giving the public the picture that fits the press conference. The rest arrives quietly, in footnotes and revisions, after the news cycle has moved on.
So: is the crime reduction real?
The NYPD’s own data cannot answer yes without reservation. Not because the numbers are fabricated. Because the system that produces them consistently generates more favorable initial headlines and less visible upward corrections later — and celebrates as historic a recovery that has not returned the city to where it was before the pandemic began. The question isn’t whether anyone is lying. The question is whether a measurement system this consistently tilted in one direction is capable of telling the truth even when it tries.
That question is not being asked in this city. The data has been sitting in two public reports, published every week, waiting for someone to read them together.
We just did.
Sources: All crime and calls-for-service data is drawn directly from the NYPD CompStat report and the NYPD Citywide Quality of Life Stat report, both covering the period through March 22, 2026, and the NYPD February 2026 press release. Historical felony offense data (2000–2025) is drawn from the NYPD’s published Seven Major Felony Offenses historical table. The revision analysis is the independent research of Vital City, available at vitalcitynyc.org. The finding that 42% of 2025 NYPD 911 calls were categorized as crime related is drawn from the Vera Institute’s analysis of 3.6 million calls, as reported by THE CITY on March 11, 2026. The observations regarding the compounding effect of upward baseline revisions on reported year-over-year declines, and the comparison of current crime levels against pre-pandemic 2019 baselines, are the original analysis of this author, developed independently from and building upon Vital City’s findings.
Follow @SamAntar on X for updates.
Written by Sam Antar | Forensic Accountant & Fraud Investigator
© 2026 Sam Antar. All rights reserved.